
CAETI UAI
Document register
- Poster1 pagePublished
- Presentation videoYouTubePublished
- Bill of materials5 KBPublished
- Team description paper11 pagesPublished
- Engineering journalNot shared
- Source code1.1 MB · GitHubPublished
Sharing each document is the team's decision. “Not shared” means this team chose not to publish it, or did not submit one — not that it is missing from the archive.
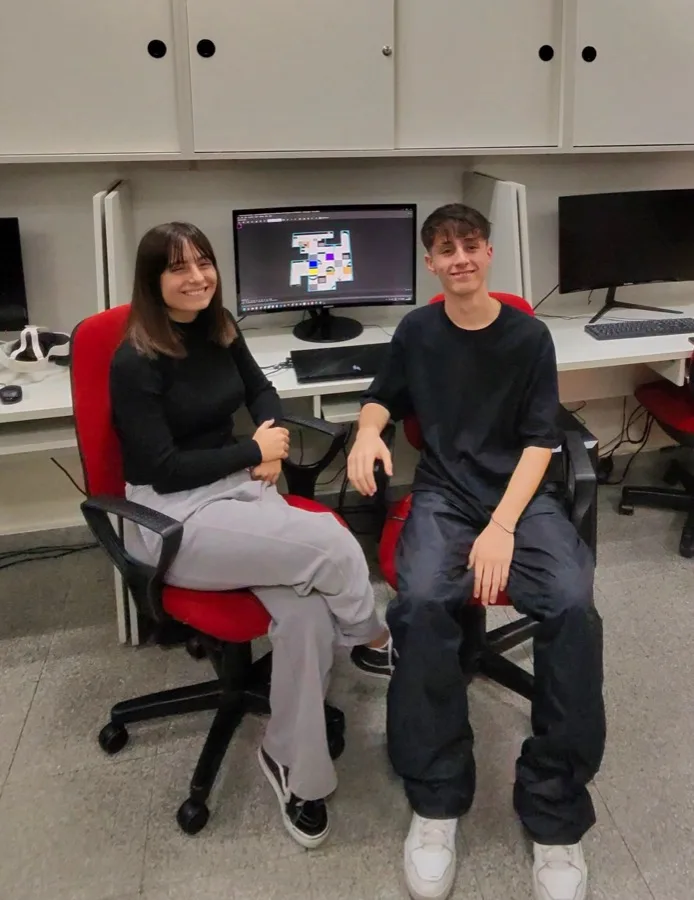
In their words
Our team will present a robot designed for the RoboCupJunior Rescue Simulation 2026 competition, built for autonomous navigation in disaster environments. The robot uses three cameras — left, front, and right — for sign detection, victim recognition, cognitive target classification, and tile identification. A front-facing distance sensor works alongside the LIDAR for obstacle detection: the front camera helps filter out false positives by excluding known colours such as cognitive target rings and wall tones, ensuring only true obstacles are confirmed. The LIDAR also serves as the primary positioning tool: its front ray acts as a virtual ruler, calculating displacement from movement-to-movement distance differences, complemented by GPS averaging during stationary moments and stronger corrections after Lack of Progress events.
The robot navigates using a hybrid pathfinding system combining Dijkstra's algorithm for global route planning and Greedy Best-First Search at the pixel level for tight spaces. The map expands dynamically as the robot explores, with obstacles recorded as non-traversable and marked as "X" in the matrix representation. Fake tokens are identified through the image processing pipeline itself — tokens that cannot be matched to a known pattern are rejected by elimination, without requiring separate hardware. Cognitive targets are classified through a colour scoring system applied along the visible arc of the token.
Our robot stands out for integrating reliable positioning, robust detection, and adaptive mapping into a fully autonomous system capable of tackling the specific challenges of the 2026 ruleset.
Poster
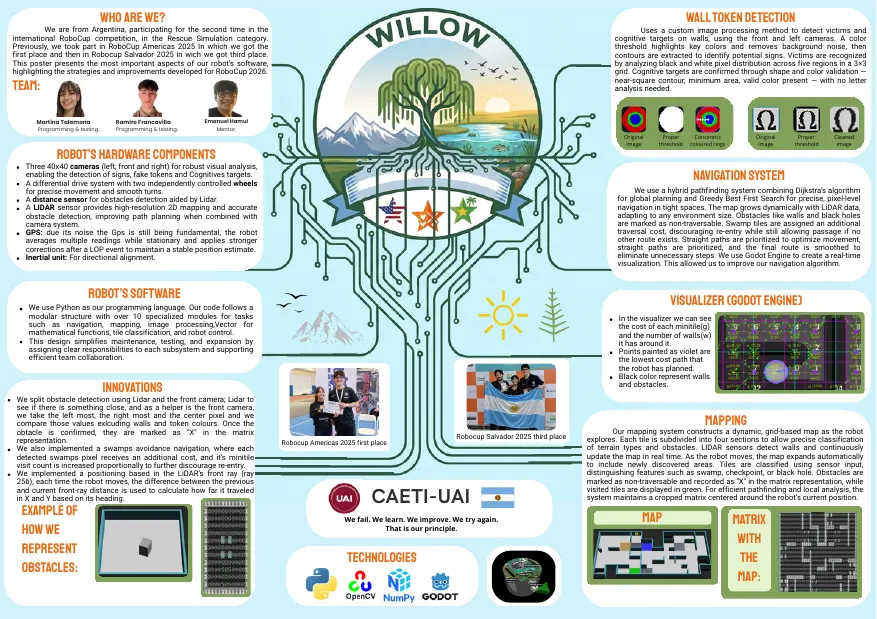
Read the text of this document — 759 words
Who are We? wall token detection
We are from Argentina, participating for the second time in the Uses a custom image processing method to detect victims and
international RoboCup competition, in the Rescue Simulation category. cognitive targets on walls, using the front and left cameras. A color
Previously, we took part in RoboCup Americas 2025 In which we got the threshold highlights key colors and removes background noise, then
first place and then in Robocup Salvador 2025 in wich we got third place. contours are extracted to identify potential signs. Victims are recognized
This poster presents the most important aspects of our robot's software, by analyzing black and white pixel distribution across five regions in a 3×3
highlighting the strategies and improvements developed for RoboCup 2026. grid. Cognitive targets are confirmed through shape and color validation —
near-square contour, minimum area, valid color present — with no letter
team: analysis needed.
Martina Talamona Ramiro Francavilla Emanuel Hamui
Programming & testing. Programming & testing. Mentor.
Original Proper Concentric Original Proper Cleaned
image threshold coloured rings image threshold image
robot’s hardware components
Three 40x40 cameras (left, front and right) for robust visual analysis,
enabling the detection of signs, fake tokens and Cognitives targets.
A differential drive system with two independently controlled wheels
navigation system
for precise movement and smooth turns. We use a hybrid pathfinding system combining Dijkstra’s algorithm
A distance sensor for obstacles detection aided by Lidar. for global planning and Greedy Best First Search for precise, pixel-level
A LIDAR sensor provides high-resolution 2D mapping and accurate navigation in tight spaces. The map grows dynamically with LiDAR data,
obstacle detection, improving path planning when combined with adapting to any environment size. Obstacles like walls and black holes
camera system. are marked as non-traversable. Swamp tiles are assigned an additional
GPS: due its noise the Gps is still being fundamental, the robot traversal cost, discouraging re-entry while still allowing passage if no
averages multiple readings while stationary and applies stronger other route exists. Straight paths are prioritized to optimize movement,
corrections after a LOP event to maintain a stable position estimate. straight paths are prioritized, and the final route is smoothed to
Inertial unit: For directional alignment. eliminate unnecessary steps. We use Godot Engine to create a real-time
visualization. This allowed us to improve our navigation algorithm.
robot’s software visualizer (godot engine)
We use Python as our programming language. Our code follows a
modular structure with over 10 specialized modules for tasks In the visualizer we can see
such as navigation, mapping, image processing,Vector for the cost of each minitile(g)
mathematical functions, tile classification, and robot control. and the number of walls(w)
This design simplifies maintenance, testing, and expansion by it has around it.
assigning clear responsibilities to each subsystem and supporting Points painted as violet are
efficient team collaboration. the lowest cost path that
the robot has planned.
Black color represent walls
innovations and obstacles.
We split obstacle detection using Lidar and the front camera; Lidar to
see if there is something close, and as a helper is the front camera,
we take the left most, the right most and the center pixel and we
compare those values exlcuding walls and token colours. Once the mapping
obtacle is confirmed, they are marked as "X" in the matrix Our mapping system constructs a dynamic, grid-based map as the robot
Robocup Salvador 2025 third place explores. Each tile is subdivided into four sections to allow precise classification
representation. Robocup Americas 2025 first place
We also implemented a swamps avoidance navigation, where each of terrain types and obstacles. LIDAR sensors detect walls and continuously
detected swamps pixel receives an additional cost, and it’s minitile update the map in real time. As the robot moves, the map expands automatically
visit count is increased proportionally to further discourage re-entry. to include newly discovered areas. Tiles are classified using sensor input,
We implemented a positioning based in the LiDAR’s front ray (ray distinguishing features such as swamp, checkpoint, or black hole. Obstacles are
256), each time the robot moves, the difference between the previous marked as non-traversable and recorded as "X" in the matrix representation, while
visited tiles are displayed in green. For efficient pathfinding and local analysis, the
CAETI-UAI
and current front-ray distance is used to calculate how far it traveled
in X and Y based on its heading. system maintains a cropped matrix centered around the robot’s current position.
example of Map
We fail. We learn. We improve. We try again. matrix
how we That is our principle.
with
represent
technologies the
obstacles:
Map:
1 page, rendered as images so they load quickly. The text above is the document's own, extracted from the PDF.
Presentation video
Hosted on YouTube. The player loads only when you press play.
Bill of materials
Shown as the original PDF, because this one is smaller that way and its text stays selectable and searchable.
Team description paper
Show the remaining 8 pages

Read the text of this document — 4079 words
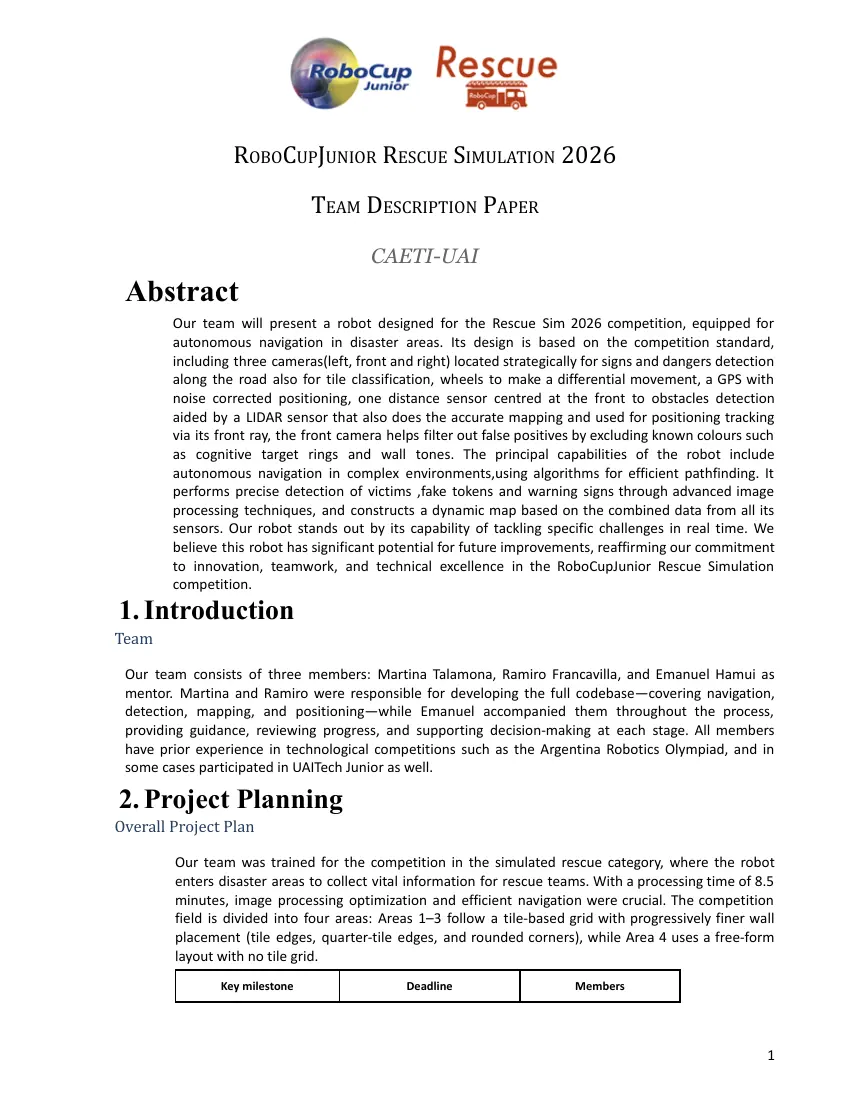
ROBOCUPJUNIOR RESCUE SIMULATION 2026
TEAM DESCRIPTION PAPER
CAETI-UAI
Abstract
Our team will present a robot designed for the Rescue Sim 2026 competition, equipped for
autonomous navigation in disaster areas. Its design is based on the competition standard,
including three cameras(left, front and right) located strategically for signs and dangers detection
along the road also for tile classification, wheels to make a differential movement, a GPS with
noise corrected positioning, one distance sensor centred at the front to obstacles detection
aided by a LIDAR sensor that also does the accurate mapping and used for positioning tracking
via its front ray, the front camera helps filter out false positives by excluding known colours such
as cognitive target rings and wall tones. The principal capabilities of the robot include
autonomous navigation in complex environments,using algorithms for efficient pathfinding. It
performs precise detection of victims ,fake tokens and warning signs through advanced image
processing techniques, and constructs a dynamic map based on the combined data from all its
sensors. Our robot stands out by its capability of tackling specific challenges in real time. We
believe this robot has significant potential for future improvements, reaffirming our commitment
to innovation, teamwork, and technical excellence in the RoboCupJunior Rescue Simulation
competition.
1.Introduction
Team
Our team consists of three members: Martina Talamona, Ramiro Francavilla, and Emanuel Hamui as
mentor. Martina and Ramiro were responsible for developing the full codebase—covering navigation,
detection, mapping, and positioning—while Emanuel accompanied them throughout the process,
providing guidance, reviewing progress, and supporting decision-making at each stage. All members
have prior experience in technological competitions such as the Argentina Robotics Olympiad, and in
some cases participated in UAITech Junior as well.
2.Project Planning
Overall Project Plan
Our team was trained for the competition in the simulated rescue category, where the robot
enters disaster areas to collect vital information for rescue teams. With a processing time of 8.5
minutes, image processing optimization and efficient navigation were crucial. The competition
field is divided into four areas: Areas 1–3 follow a tile-based grid with progressively finer wall
placement (tile edges, quarter-tile edges, and rounded corners), while Area 4 uses a free-form
layout with no tile grid.
Key milestone Deadline Members
1
Image Processor January 15, 2026 Martina
SuperVisor Messages February 1, 2026 Martina
sending
Distance sensor implementation February 20,2026 Ramiro
Fakes detection March 5,2026 Martina
Obstacles Detection March 15,2026 Ramiro
Positioning with lidar April 14,2026 Ramiro
Navigation with swamps May 16,2026 Ramiro
Mapping june 14,,2026 Martina
b. Integration Plan
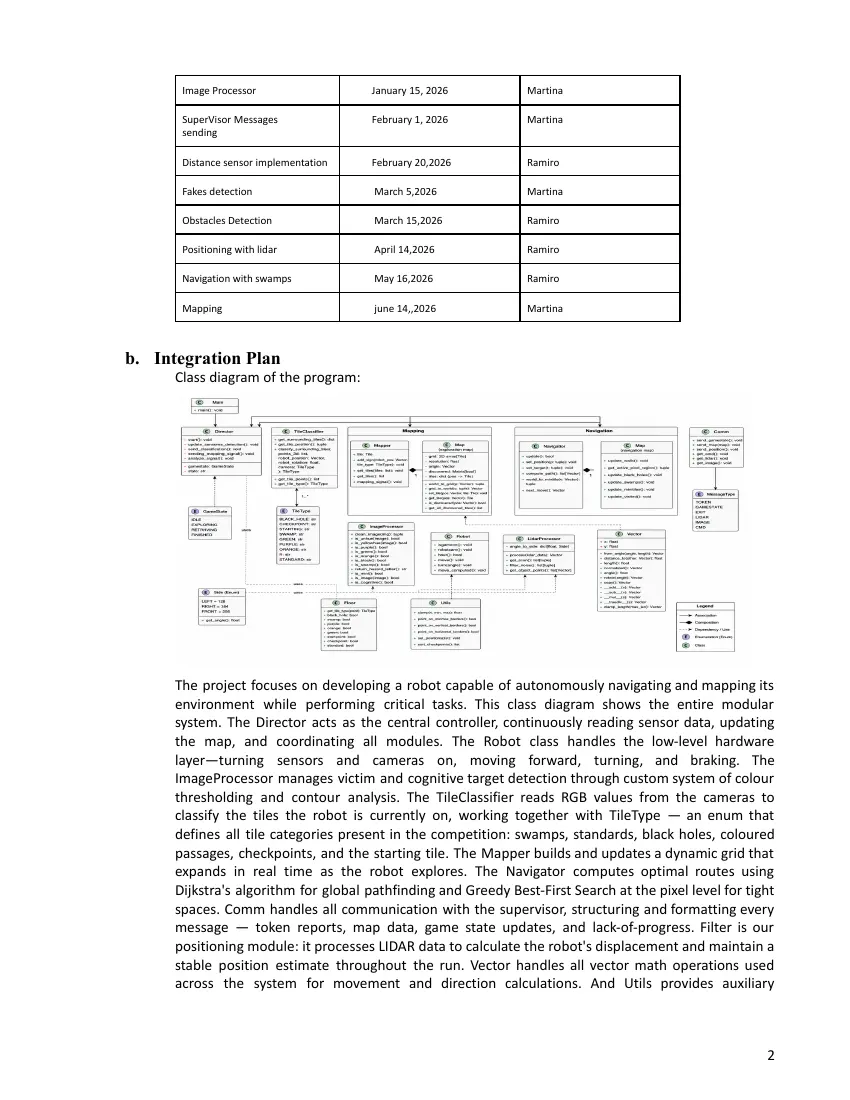
Class diagram of the program:
The project focuses on developing a robot capable of autonomously navigating and mapping its
environment while performing critical tasks. This class diagram shows the entire modular
system. The Director acts as the central controller, continuously reading sensor data, updating
the map, and coordinating all modules. The Robot class handles the low-level hardware
layer—turning sensors and cameras on, moving forward, turning, and braking. The
ImageProcessor manages victim and cognitive target detection through custom system of colour
thresholding and contour analysis. The TileClassifier reads RGB values from the cameras to
classify the tiles the robot is currently on, working together with TileType — an enum that
defines all tile categories present in the competition: swamps, standards, black holes, coloured
passages, checkpoints, and the starting tile. The Mapper builds and updates a dynamic grid that
expands in real time as the robot explores. The Navigator computes optimal routes using
Dijkstra's algorithm for global pathfinding and Greedy Best-First Search at the pixel level for tight
spaces. Comm handles all communication with the supervisor, structuring and formatting every
message — token reports, map data, game state updates, and lack-of-progress. Filter is our
positioning module: it processes LIDAR data to calculate the robot's displacement and maintain a
stable position estimate throughout the run. Vector handles all vector math operations used
across the system for movement and direction calculations. And Utils provides auxiliary
2
functions shared across modules: vector operations, angle calculations, and general-purpose
functions used across the system.
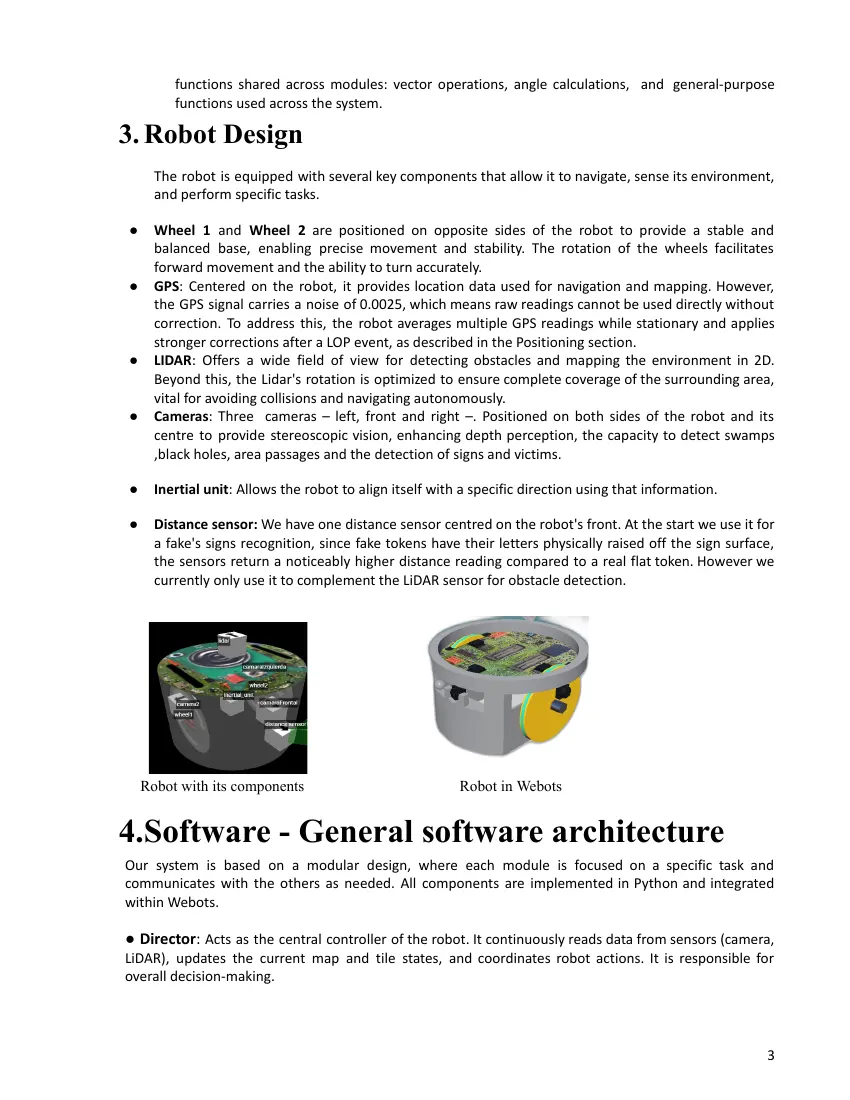
3.Robot Design
The robot is equipped with several key components that allow it to navigate, sense its environment,
and perform specific tasks.
● Wheel 1 and Wheel 2 are positioned on opposite sides of the robot to provide a stable and
balanced base, enabling precise movement and stability. The rotation of the wheels facilitates
forward movement and the ability to turn accurately.
● GPS: Centered on the robot, it provides location data used for navigation and mapping. However,
the GPS signal carries a noise of 0.0025, which means raw readings cannot be used directly without
correction. To address this, the robot averages multiple GPS readings while stationary and applies
stronger corrections after a LOP event, as described in the Positioning section.
● LIDAR: Offers a wide field of view for detecting obstacles and mapping the environment in 2D.
Beyond this, the Lidar's rotation is optimized to ensure complete coverage of the surrounding area,
vital for avoiding collisions and navigating autonomously.
● Cameras: Three cameras – left, front and right –. Positioned on both sides of the robot and its
centre to provide stereoscopic vision, enhancing depth perception, the capacity to detect swamps
,black holes, area passages and the detection of signs and victims.
● Inertial unit: Allows the robot to align itself with a specific direction using that information.
● Distance sensor: We have one distance sensor centred on the robot's front. At the start we use it for
a fake's signs recognition, since fake tokens have their letters physically raised off the sign surface,
the sensors return a noticeably higher distance reading compared to a real flat token. However we
currently only use it to complement the LiDAR sensor for obstacle detection.
Robot with its components Robot in Webots
4.Software - General software architecture
Our system is based on a modular design, where each module is focused on a specific task and
communicates with the others as needed. All components are implemented in Python and integrated
within Webots.
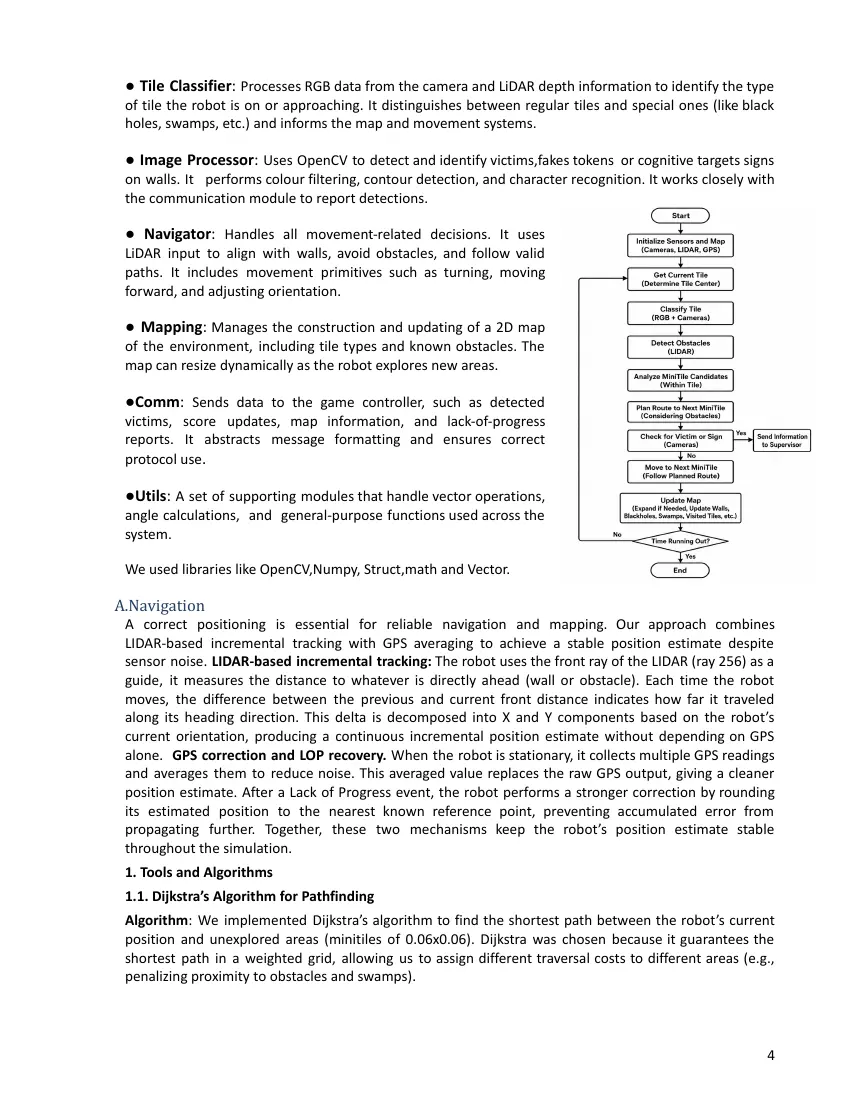
● Director: Acts as the central controller of the robot. It continuously reads data from sensors (camera,
LiDAR), updates the current map and tile states, and coordinates robot actions. It is responsible for
overall decision-making.
3
● Tile Classifier: Processes RGB data from the camera and LiDAR depth information to identify the type
of tile the robot is on or approaching. It distinguishes between regular tiles and special ones (like black
holes, swamps, etc.) and informs the map and movement systems.
● Image Processor: Uses OpenCV to detect and identify victims,fakes tokens or cognitive targets signs
on walls. It performs colour filtering, contour detection, and character recognition. It works closely with
the communication module to report detections.
● Navigator: Handles all movement-related decisions. It uses
LiDAR input to align with walls, avoid obstacles, and follow valid
paths. It includes movement primitives such as turning, moving
forward, and adjusting orientation.
● Mapping: Manages the construction and updating of a 2D map
of the environment, including tile types and known obstacles. The
map can resize dynamically as the robot explores new areas.
●Comm: Sends data to the game controller, such as detected
victims, score updates, map information, and lack-of-progress
reports. It abstracts message formatting and ensures correct
protocol use.
●Utils: A set of supporting modules that handle vector operations,
angle calculations, and general-purpose functions used across the
system.
We used libraries like OpenCV,Numpy, Struct,math and Vector.
A.Navigation
A correct positioning is essential for reliable navigation and mapping. Our approach combines
LIDAR-based incremental tracking with GPS averaging to achieve a stable position estimate despite
sensor noise. LIDAR-based incremental tracking: The robot uses the front ray of the LIDAR (ray 256) as a
guide, it measures the distance to whatever is directly ahead (wall or obstacle). Each time the robot
moves, the difference between the previous and current front distance indicates how far it traveled
along its heading direction. This delta is decomposed into X and Y components based on the robot’s
current orientation, producing a continuous incremental position estimate without depending on GPS
alone. GPS correction and LOP recovery. When the robot is stationary, it collects multiple GPS readings
and averages them to reduce noise. This averaged value replaces the raw GPS output, giving a cleaner
position estimate. After a Lack of Progress event, the robot performs a stronger correction by rounding
its estimated position to the nearest known reference point, preventing accumulated error from
propagating further. Together, these two mechanisms keep the robot’s position estimate stable
throughout the simulation.
1. Tools and Algorithms
1.1. Dijkstra’s Algorithm for Pathfinding
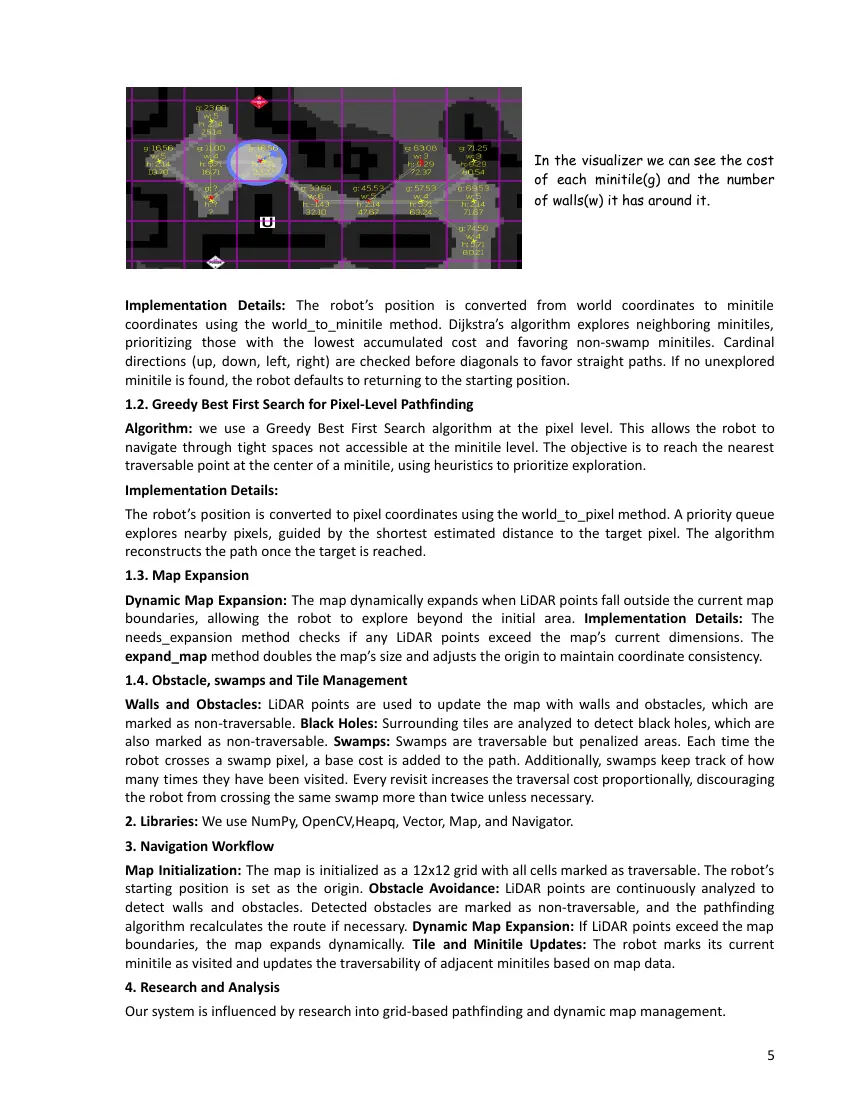
Algorithm: We implemented Dijkstra’s algorithm to find the shortest path between the robot’s current
position and unexplored areas (minitiles of 0.06x0.06). Dijkstra was chosen because it guarantees the
shortest path in a weighted grid, allowing us to assign different traversal costs to different areas (e.g.,
penalizing proximity to obstacles and swamps).
4
In the visualizer we can see the cost
of each minitile(g) and the number
of walls(w) it has around it.
Implementation Details: The robot’s position is converted from world coordinates to minitile
coordinates using the world_to_minitile method. Dijkstra’s algorithm explores neighboring minitiles,
prioritizing those with the lowest accumulated cost and favoring non-swamp minitiles. Cardinal
directions (up, down, left, right) are checked before diagonals to favor straight paths. If no unexplored
minitile is found, the robot defaults to returning to the starting position.
1.2. Greedy Best First Search for Pixel-Level Pathfinding
Algorithm: we use a Greedy Best First Search algorithm at the pixel level. This allows the robot to
navigate through tight spaces not accessible at the minitile level. The objective is to reach the nearest
traversable point at the center of a minitile, using heuristics to prioritize exploration.
Implementation Details:
The robot’s position is converted to pixel coordinates using the world_to_pixel method. A priority queue
explores nearby pixels, guided by the shortest estimated distance to the target pixel. The algorithm
reconstructs the path once the target is reached.
1.3. Map Expansion
Dynamic Map Expansion: The map dynamically expands when LiDAR points fall outside the current map
boundaries, allowing the robot to explore beyond the initial area. Implementation Details: The
needs_expansion method checks if any LiDAR points exceed the map’s current dimensions. The
expand_map method doubles the map’s size and adjusts the origin to maintain coordinate consistency.
1.4. Obstacle, swamps and Tile Management
Walls and Obstacles: LiDAR points are used to update the map with walls and obstacles, which are
marked as non-traversable. Black Holes: Surrounding tiles are analyzed to detect black holes, which are
also marked as non-traversable. Swamps: Swamps are traversable but penalized areas. Each time the
robot crosses a swamp pixel, a base cost is added to the path. Additionally, swamps keep track of how
many times they have been visited. Every revisit increases the traversal cost proportionally, discouraging
the robot from crossing the same swamp more than twice unless necessary.
2. Libraries: We use NumPy, OpenCV,Heapq, Vector, Map, and Navigator.
3. Navigation Workflow
Map Initialization: The map is initialized as a 12x12 grid with all cells marked as traversable. The robot’s
starting position is set as the origin. Obstacle Avoidance: LiDAR points are continuously analyzed to
detect walls and obstacles. Detected obstacles are marked as non-traversable, and the pathfinding
algorithm recalculates the route if necessary. Dynamic Map Expansion: If LiDAR points exceed the map
boundaries, the map expands dynamically. Tile and Minitile Updates: The robot marks its current
minitile as visited and updates the traversability of adjacent minitiles based on map data.
4. Research and Analysis
Our system is influenced by research into grid-based pathfinding and dynamic map management.
5
Dijkstra’s algorithm was chosen for its ability to guarantee the shortest path in weighted grids and to
handle variable traversal costs. Greedy Best First Search is used at the pixel level for its efficiency in
complex environments, allowing the robot to quickly find feasible paths in tight spaces.
5. Testing and Validation
The robot was tested in various obstacle layouts and map sizes.
Pathfinding Time: Measured the time taken to calculate paths.
Map Expansion: Verified correct expansion and coordinate consistency.
Obstacle Avoidance: Ensured the robot avoided obstacles and recalculated paths as needed.
We used Godot Engine to visualize the robot’s environment. The map shows obstacles, traversable areas,
and the robot’s path with real-time data like cost (g), Walls (w), and heuristic (h).
6.Innovations and Unique Approaches
Dynamic map Expansion: the ability to expand the map dynamically based on LIDAR data ensures that
the robot can handle environments of arbitrary size.
Swamp avoidance: Each time a swamp pixel is detected, an additional cost is assigned to that pixel.
Additionally, a system was implemented to increase the visit count of swamp minitiles, further increasing
their traversal cost proportionally.
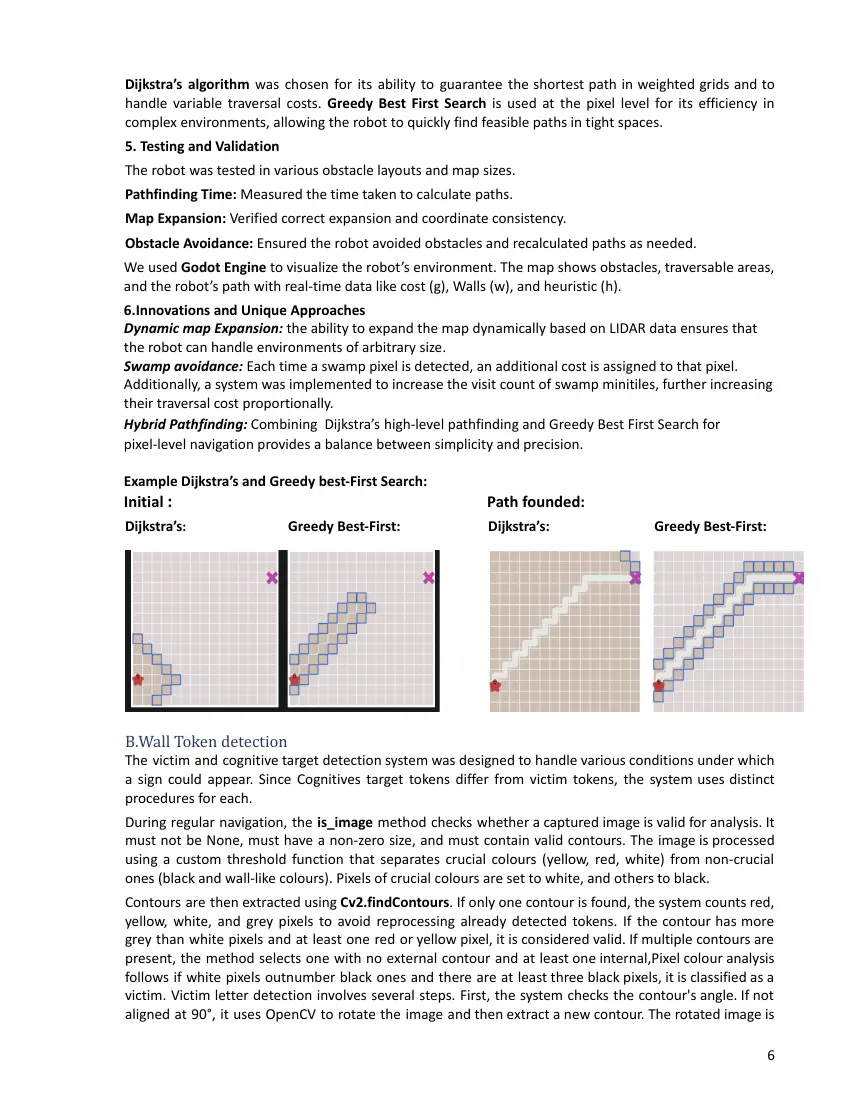
Hybrid Pathfinding: Combining Dijkstra’s high-level pathfinding and Greedy Best First Search for
pixel-level navigation provides a balance between simplicity and precision.
Example Dijkstra’s and Greedy best-First Search:
Initial : Path founded:
Dijkstra’s: Greedy Best-First: Dijkstra’s: Greedy Best-First:
B.Wall Token detection
The victim and cognitive target detection system was designed to handle various conditions under which
a sign could appear. Since Cognitives target tokens differ from victim tokens, the system uses distinct
procedures for each.
During regular navigation, the is_image method checks whether a captured image is valid for analysis. It
must not be None, must have a non-zero size, and must contain valid contours. The image is processed
using a custom threshold function that separates crucial colours (yellow, red, white) from non-crucial
ones (black and wall-like colours). Pixels of crucial colours are set to white, and others to black.
Contours are then extracted using Cv2.findContours. If only one contour is found, the system counts red,
yellow, white, and grey pixels to avoid reprocessing already detected tokens. If the contour has more
grey than white pixels and at least one red or yellow pixel, it is considered valid. If multiple contours are
present, the method selects one with no external contour and at least one internal,Pixel colour analysis
follows if white pixels outnumber black ones and there are at least three black pixels, it is classified as a
victim. Victim letter detection involves several steps. First, the system checks the contour's angle. If not
aligned at 90°, it uses OpenCV to rotate the image and then extract a new contour. The rotated image is
6
cleaned again using a threshold of 125, and the clean_letter method identifies the lowest-hierarchy
contour. With the correct contour, the image is sectioned into a 3×3 grid using Cv2.BoundingRect, and
the nine zones are used: upper, middle, left, lower, right, upper-right, upper-left, lower-right and
lower-right. In each zone, black and white pixels are counted to calculate percentages. These values are
stored in a dictionary. A letter is determined by analyzing the pixel distribution across zones:
● S: four black regions
● H: two white regions
● If only one white region:
■ U: if the middle region has >90% white
■ H: if the middle is predominantly black
Cognitive target detection:Cognitive targets follow a two-stage detection pipeline. First, the system
confirms a valid token is present: the contour must not touch the frame borders, must have a minimum
area of 100 pixels, be approximately square (width-height difference below 8 pixels), and contain no white
pixels — since white indicates a victim or an already-seen token. A custom colour threshold keeps black
pixels as valid, unlike the victim threshold, since cognitive tokens can include black in their design. Once
confirmed, the token is classified using clean_circle: a minimum enclosing circle is fitted to the contour and
five points are sampled along the radius on the fully visible side of the token. Each point's colour is
assigned a numeric score, and the sum determines the final letter: 0 → F, 1 → P, 2 → C, 3 → O. This makes
classification robust to partial occlusion by the frame border.
Fake token detection: When a sign is detected, the system attempts to extract and validate a contour from
the image. For victim tokens, if no valid contour is found or the contour does not meet the conditions
required for letter analysis — minimum area, approximate square shape, correct hierarchy — the image is
considered unanalysable and the token is treated as fake. For cognitive targets, the contour passes a shape
and colour validation, but the token is then classified by sampling colour scores along its visible arc. If the
resulting score does not match any known pattern, the token is discarded as fake. In both cases, fake
tokens are neither reported to the supervisor nor added to the map.
Illustrations:
Example n°1: Victims
Original Img. Thresh + contours. Cleaned img.
Example n°2: Cognitive
Original Img. Thresh img. Concentric coloured rings.
To test them, we had a test robot record images, and then we verified what it detected. With the results,
we adjusted thresholds for both victims and cognitive targets. Finally, we believe the following solutions
are interesting and innovative:
● Cognitives thresholds: A method of recognizing hazmat was used in which, based on their RGB values,
they are categorized as yellow, red, white, or black, and the type of hazmat is verified based on these
categories.
● Letter contour cut out: A way of adapting the letter recognition no matter the noise, orientation or any
random factor of the simulation; the percentages of black and white pixels of each letter is an
invariable fact.
7
● Own thresh: Cleaning images with Opencv methods provides a great success in general, but for some
border cases, this pre-made methods do not support some irregularities; so the exercise of thinking
how to “create” an own method (based on an existing one) and solve border cases, It is an enriching
experience for code performance and for programmers knowledge of the libraries and their own codes.
C.Mapping
Our mapping system is designed to dynamically represent the robot's environment, enabling accurate
tracking of visited areas and tile classification. This dynamic representation is crucial for efficient
navigation and real-time decision-making during the competition.
1. Dynamic Map Representation
The map is implemented as a grid of pixels, where each pixel represents a small area of the real-world
simulation. Each tile in the environment is modeled as a 12×12 pixel block. The map begins as a fixed-size
12×12 grid, with all cells initialized as traversable (value 255 in grayscale). As the robot explores, the map
expands automatically when LiDAR points exceed the current dimensions, maintaining accurate scaling.
The Expand_map method doubles the map’s size and adjusts the origin to keep the coordinate system
consistent. Tile Classification: The map environment is divided into tiles, which are further subdivided into
quarters for enhanced precision. Each tile is classified based on its RGB colour values and LiDAR data.
Standard types include: swamp tiles, checkpoints, starting tiles, black holes, and more. The
world_to_minitile function translates world coordinates into grid cell indices. world_to_quarter_side
determines the corresponding quarter of the tile. The Mapper class manages this classification and
updates tile types as new information is detected by the robot’s sensors.
1.2. Obstacle Detection
We split obstacle detection into two cases: tall obstacles are detected
using the LIDAR alone, while low obstacles —which the LIDAR may
miss— are detected through a combination of LIDAR and a front-facing
distance sensor. In both cases, confirmed obstacles are marked as "X" in
the matrix representation, distinguishing them clearly from walls and
free cells..
1.3. Map Cropping and Representation
For performance and visualization, the system can crop and focus on the
region surrounding the robot. The mapping_pixels function defines a
rectangular region around the robot’s position and extracts the relevant
map segment. Each tile in this cropped area is translated into a 5×5
matrix representation that encodes wall locations and tile types using
logical operations. Curved walls are represented using a placeholder
value (9) to distinguish them from standard empty cells (0).
2. Libraries: We use NumPy, OpenCV, Vector,Map and Mapper .
3. Mapping Workflow
3.1. Initialization
The map is initialized as a 12×12 grid. The robot’s starting position is set
as the origin, simplifying calculations.
3.2. Expansion
If any LiDAR points exceed current dimensions, needs_expansion
8
triggers the expand_map method, ensuring the map can grow as needed.
3.3. Detection
Obstacles are added using LiDAR data. Traversable paths are updated dynamically.
3.4. Updates
The robot marks current and adjacent minitiles as visited or traversable. Tiles are updated according to
sensor inputs.
3.5. Matrix Generation
Matrix construction involves identifying the region of interest, translating pixel data into matrices, and
handling curved walls with logical fallbacks. Once constructed, this matrix provides a detailed view of the
robot’s environment.
4. Research and Analysis This system draws on principles from occupancy grids and real-time
robotics mapping. It emphasizes adaptability (via dynamic expansion), performance (optimized
for real-time updates), and clarity.
5. Testing and Validation Mapping accuracy was verified through repeated simulations. Test maps
included black holes, walls, checkpoints, and signs. We ensured the system updated in real time
and handled edge cases correctly. The Obstacle detection and matrix marking Were tested by
placing physical obstacles in various positions and verified that the LiDAR/distance sensors
correctly flagged their locations. Crucially, we confirmed that each detected obstacle was marked
with "X" in the matrix representation, clearly distinguishing it from walls and free cells.
6. Innovations and Unique Approaches. Dynamic Map Expansion: The ability to expand the map
dynamically based on LiDAR data ensures that the robot can handle environments of arbitrary size.
Quarter-Tile Classification: The world_to_quarter_side function allows for finer granularity in tile
classification, enabling more precise navigation and obstacle avoidance. Example of how we tested:
On the left is the map, on the right is the map matrix
5.Performance evaluation
9
Testing Procedures for Verifying Robot's Performance: The robot’s performance was evaluated through
continuous testing conducted alongside development, allowing quick error detection and correction.
Martina and Ramiro shared testing responsibilities while programming, building custom simulation
environments and running targeted scenarios for each module.
Evaluating Against Competition Challenges
Custom maps simulated real competition conditions to test key functions:
– Cognitives targets and Victim Detection with varied colors/symbols.
– Mapping and Navigation using mazes and tile layouts.
– Tile Classification with swamps, black holes, and standard tiles.
Analysis of Results and Impact on Development
Test results guided concrete improvements across specific modules. The GPS positioning module was the
first major challenge: raw readings drifted enough to corrupt the map after several moves, which led to
implementing the stationary averaging and LOP rounding correction described before. The fake token
detection threshold also required several calibration rounds — initial values were too sensitive and
flagged real tokens, so the threshold was raised progressively until discrimination was reliable. Cognitive
target detection initially produced false positives from wall segments with similar colours; adding the
geometry constraints (minimum area, near-square shape, no border contact,etc) resolved this without
affecting true positive rates. Overall, the iterative test-fix cycle allowed each module to be hardened
independently before integration, resulting in a more stable and reliable full system.
6.Conclusion
This year's system represents a meaningful step forward from our 2025 entry. Martina and Ramiro,
guided by Emanuel, redesigned key parts of the robot and its software to address challenges that the
previous version did not handle: GPS noise required a dedicated positioning layer combining
LIDAR-based incremental tracking with stationary averaging and LOP correction; fake token detection
was integrated into the image processing pipeline itself, where tokens that cannot be matched to a
known pattern are rejected by elimination rather than requiring a separate hardware mechanism; and
cognitive targets required a dedicated detection pipeline separate from victim letter recognition,
classifying tokens through a colour scoring system applied along the visible arc of the token. Obstacle
detection was also improved by splitting it into two cases: tall obstacles handled by the LIDAR alone, and
low obstacles detected through a combination of LIDAR and a front-facing distance sensor — with all
confirmed obstacles recorded as "X" in the matrix representation. These changes were not isolated
improvements, they are the result of daily dedication, iteration, and a genuine commitment to building
something better each time. We are confident in what we have built, and we look forward to putting it
to the test at the competition.
References
Iterative closest point: Understanding Iterative Closest Point (ICP) Algorithm with Code.
–Images:https://medium.com/@noel.benji/a-guide-to-robust-edge-detection-with-opencv-1d703506e014
–OpenCV: Contours Hierarchy. Pathfinding : Introduction to the A* Algorithm —
https://www.redblobgames.com/pathfinding/a-star/implementation.html. – RoboCupJunior Rescue Simulation
Rules 2026: https://junior.robocup.org/wp-content/uploads/2026/02/RCJRescueSimulation2026-final.pdf.
10
11
11 pages, rendered as images so they load quickly. The text above is the document's own, extracted from the PDF.
Source code
The team's own source code, 1.1 MB. It is a download rather than part of this page, because a zip is something you open on your computer. It comes from GitHub, which some school networks block.