
Anyang
Document register
- Poster1 pagePublished
- Presentation videoYouTubePublished
- Bill of materials75 KBPublished
- Team description paper19 pagesPublished
- Engineering journalNot shared
- Source code42 KB · GitHubPublished
Sharing each document is the team's decision. “Not shared” means this team chose not to publish it, or did not submit one — not that it is missing from the archive.

In their words
Our robot utilizes LiDAR sensors for mapping, integrated with an A* pathfinding algorithm and frontier-based exploration to ensure precise map reconstruction and exhaustive coverage of the entire arena. To maximize performance in the RoboCup simulation league, we have implemented a robust obstacle avoidance system and a multi-sensor fusion framework that enables seamless navigation in complex environments.
For victim identification, we employ camera data processed through a custom-trained YOLO model, achieving high accuracy in detecting victim letters. Furthermore, our system features a highly optimized recognition module for wall tokens, ensuring accurate classification and distinguishing them from victims across various mission scenarios.
Beyond basic navigation, our architecture incorporates a dynamic re-planning strategy that allows the robot to adapt to unexpected obstacles in real-time. By utilizing a multi-threaded GUI debug viewer, we monitor internal system logic and environmental data continuously. This ensures that the robot not only identifies targets efficiently but also maintains operational stability throughout the mission, effectively bridging the gap between raw sensor input and intelligent, mission-critical decision-making.
Poster
Read the text of this document — 699 words
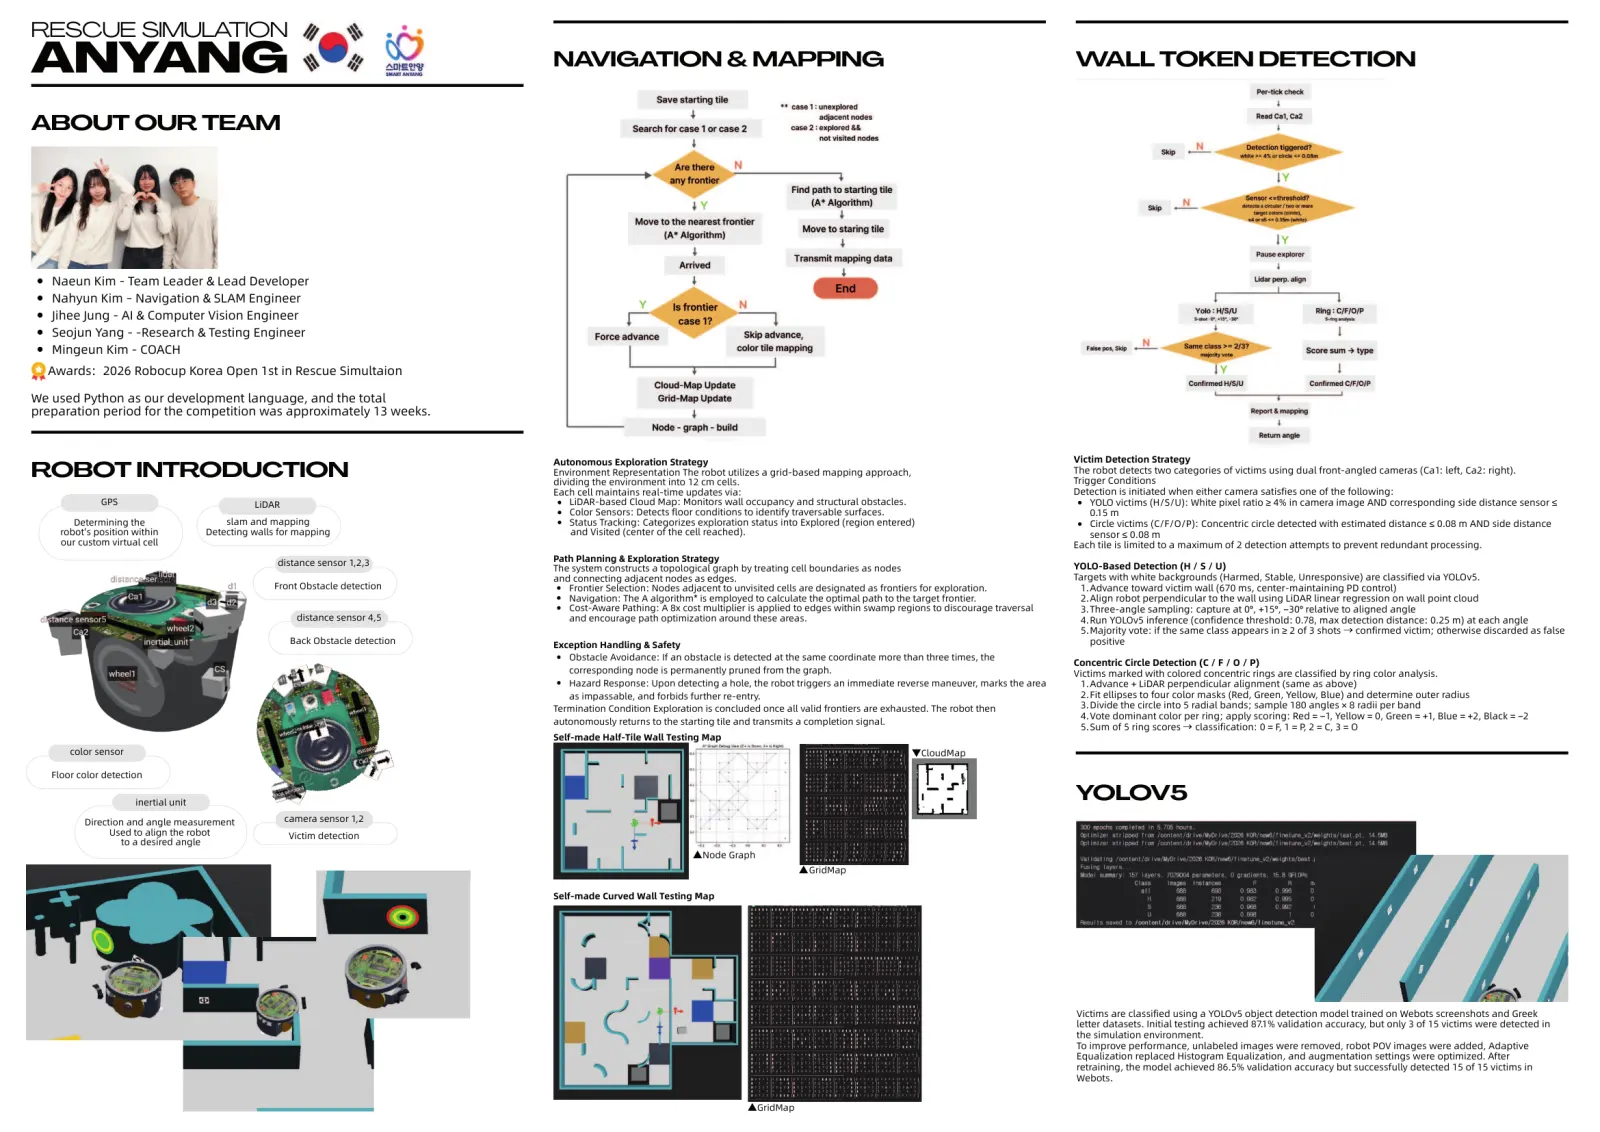
RESCUE SIMULATION
ANYANG NAVIGATION & MAPPING WALL TOKEN DETECTION
ABOUT OUR TEAM
Naeun Kim - Team Leader & Lead Developer
Nahyun Kim – Navigation & SLAM Engineer
Jihee Jung - AI & Computer Vision Engineer
Seojun Yang - -Research & Testing Engineer
Mingeun Kim - COACH
Awards: 2026 Robocup Korea Open 1st in Rescue Simultaion
We used Python as our development language, and the total
preparation period for the competition was approximately 13 weeks.
Autonomous Exploration Strategy Victim Detection Strategy
ROBOT INTRODUCTION Environment Representation The robot utilizes a grid-based mapping approach,
dividing the environment into 12 cm cells.
The robot detects two categories of victims using dual front-angled cameras (Ca1: left, Ca2: right).
Trigger Conditions
Each cell maintains real-time updates via: Detection is initiated when either camera satisfies one of the following:
GPS LiDAR LiDAR-based Cloud Map: Monitors wall occupancy and structural obstacles. YOLO victims (H/S/U): White pixel ratio ≥ 4% in camera image AND corresponding side distance sensor ≤
Color Sensors: Detects floor conditions to identify traversable surfaces. 0.15 m
Determining the slam and mapping Status Tracking: Categorizes exploration status into Explored (region entered) Circle victims (C/F/O/P): Concentric circle detected with estimated distance ≤ 0.08 m AND side distance
robot's position within Detecting walls for mapping and Visited (center of the cell reached). sensor ≤ 0.08 m
our custom virtual cell Each tile is limited to a maximum of 2 detection attempts to prevent redundant processing.
distance sensor 1,2,3 Path Planning & Exploration Strategy
The system constructs a topological graph by treating cell boundaries as nodes YOLO-Based Detection (H / S / U)
and connecting adjacent nodes as edges. Targets with white backgrounds (Harmed, Stable, Unresponsive) are classified via YOLOv5.
Front Obstacle detection Frontier Selection: Nodes adjacent to unvisited cells are designated as frontiers for exploration. 1.Advance toward victim wall (670 ms, center-maintaining PD control)
Navigation: The A algorithm* is employed to calculate the optimal path to the target frontier. 2.Align robot perpendicular to the wall using LiDAR linear regression on wall point cloud
Cost-Aware Pathing: A 8x cost multiplier is applied to edges within swamp regions to discourage traversal 3.Three-angle sampling: capture at 0°, +15°, −30° relative to aligned angle
distance sensor 4,5 and encourage path optimization around these areas. 4.Run YOLOv5 inference (confidence threshold: 0.78, max detection distance: 0.25 m) at each angle
5.Majority vote: if the same class appears in ≥ 2 of 3 shots→ confirmed victim; otherwise discarded as false
Back Obstacle detection Exception Handling & Safety positive
Obstacle Avoidance: If an obstacle is detected at the same coordinate more than three times, the
Concentric Circle Detection (C / F / O / P)
corresponding node is permanently pruned from the graph. Victims marked with colored concentric rings are classified by ring color analysis.
Hazard Response: Upon detecting a hole, the robot triggers an immediate reverse maneuver, marks the area 1.Advance + LiDAR perpendicular alignment (same as above)
as impassable, and forbids further re-entry. 2.Fit ellipses to four color masks (Red, Green, Yellow, Blue) and determine outer radius
Termination Condition Exploration is concluded once all valid frontiers are exhausted. The robot then 3.Divide the circle into 5 radial bands; sample 180 angles × 8 radii per band
4.Vote dominant color per ring; apply scoring: Red = −1, Yellow = 0, Green = +1, Blue = +2, Black = −2
autonomously returns to the starting tile and transmits a completion signal.
5.Sum of 5 ring scores → classification: 0 = F, 1 = P, 2 = C, 3 = O
Self-made Half-Tile Wall Testing Map
color sensor ▼CloudMap
Floor color detection
inertial unit
YOLOV5
Direction and angle measurement camera sensor 1,2
Used to align the robot Victim detection
to a desired angle
▲Node Graph
▲GridMap
Self-made Curved Wall Testing Map
Victims are classified using a YOLOv5 object detection model trained on Webots screenshots and Greek
letter datasets. Initial testing achieved 87.1% validation accuracy, but only 3 of 15 victims were detected in
the simulation environment.
To improve performance, unlabeled images were removed, robot POV images were added, Adaptive
Equalization replaced Histogram Equalization, and augmentation settings were optimized. After
retraining, the model achieved 86.5% validation accuracy but successfully detected 15 of 15 victims in
Webots.
▲GridMap
1 page, rendered as images so they load quickly. The text above is the document's own, extracted from the PDF.
Presentation video
Hosted on YouTube. The player loads only when you press play.
Bill of materials
Shown as the original PDF, because this one is smaller that way and its text stays selectable and searchable.
Team description paper
Show the remaining 16 pages
Read the text of this document — 3667 words
Rescue
Simulation_Anyang_Additional
Software Reference
Documents
2. Robot Design
2-1. Robot configuration + sensors
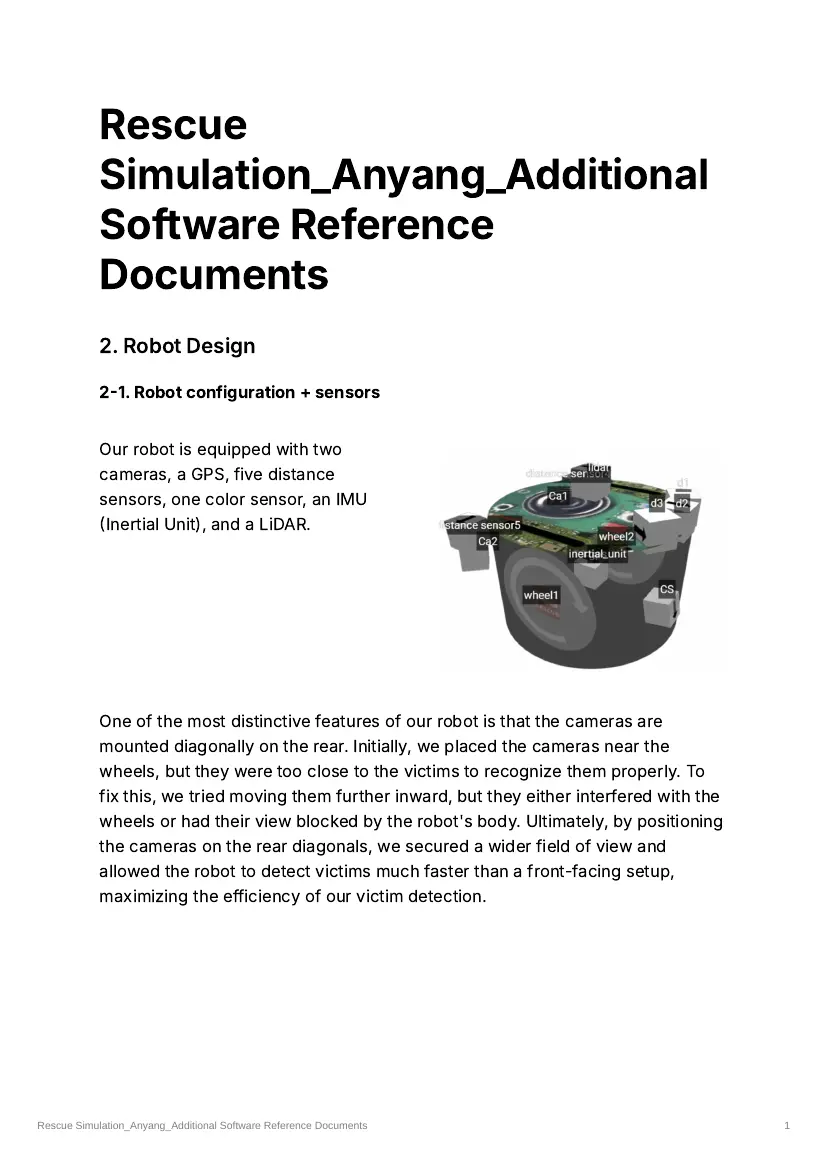
Our robot is equipped with two
cameras, a GPS, five distance
sensors, one color sensor, an IMU
(Inertial Unit), and a LiDAR.
One of the most distinctive features of our robot is that the cameras are
mounted diagonally on the rear. Initially, we placed the cameras near the
wheels, but they were too close to the victims to recognize them properly. To
fix this, we tried moving them further inward, but they either interfered with the
wheels or had their view blocked by the robot's body. Ultimately, by positioning
the cameras on the rear diagonals, we secured a wider field of view and
allowed the robot to detect victims much faster than a front-facing setup,
maximizing the efficiency of our victim detection.
Rescue Simulation_Anyang_Additional Software Reference Documents 1
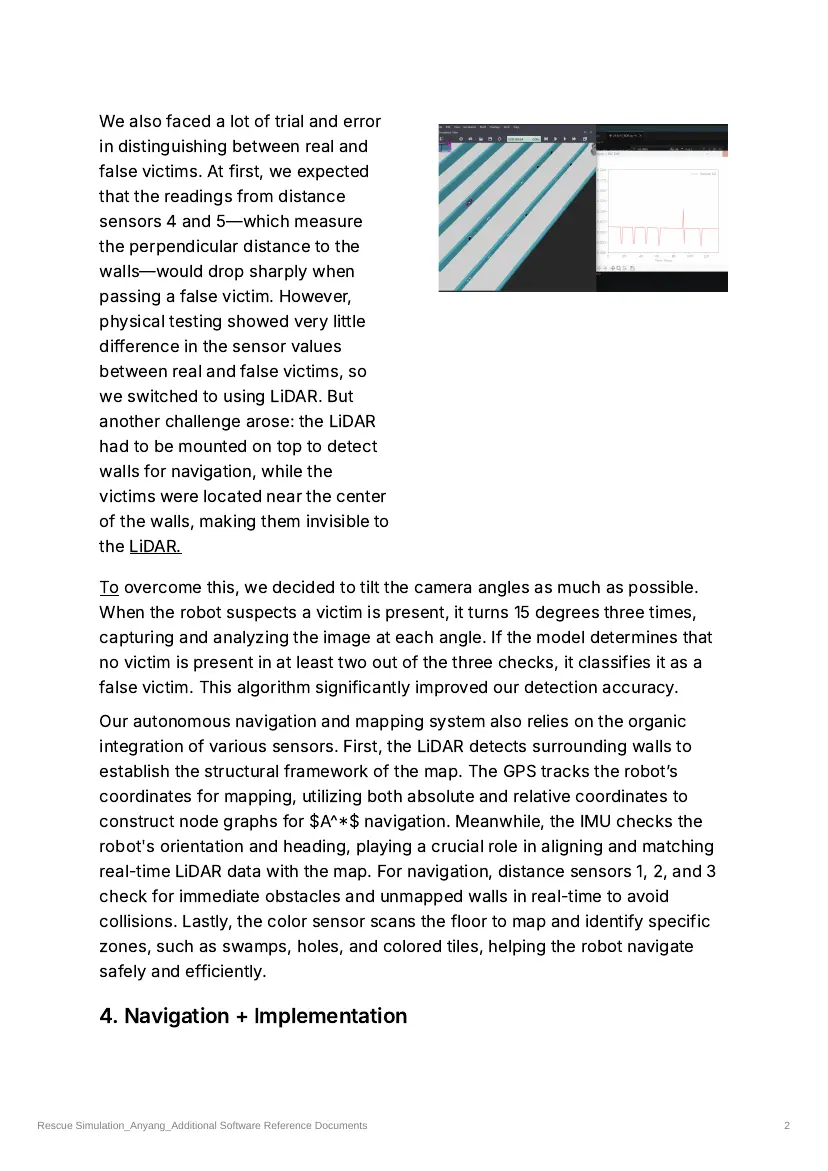
We also faced a lot of trial and error
in distinguishing between real and
false victims. At first, we expected
that the readings from distance
sensors 4 and 5—which measure
the perpendicular distance to the
walls—would drop sharply when
passing a false victim. However,
physical testing showed very little
difference in the sensor values
between real and false victims, so
we switched to using LiDAR. But
another challenge arose: the LiDAR
had to be mounted on top to detect
walls for navigation, while the
victims were located near the center
of the walls, making them invisible to
the LiDAR.
To overcome this, we decided to tilt the camera angles as much as possible.
When the robot suspects a victim is present, it turns 15 degrees three times,
capturing and analyzing the image at each angle. If the model determines that
no victim is present in at least two out of the three checks, it classifies it as a
false victim. This algorithm significantly improved our detection accuracy.
Our autonomous navigation and mapping system also relies on the organic
integration of various sensors. First, the LiDAR detects surrounding walls to
establish the structural framework of the map. The GPS tracks the robot’s
coordinates for mapping, utilizing both absolute and relative coordinates to
construct node graphs for $A^*$ navigation. Meanwhile, the IMU checks the
robot's orientation and heading, playing a crucial role in aligning and matching
real-time LiDAR data with the map. For navigation, distance sensors 1, 2, and 3
check for immediate obstacles and unmapped walls in real-time to avoid
collisions. Lastly, the color sensor scans the floor to map and identify specific
zones, such as swamps, holes, and colored tiles, helping the robot navigate
safely and efficiently.
4. Navigation + Implementation
Rescue Simulation_Anyang_Additional Software Reference Documents 2
4-1. Overview
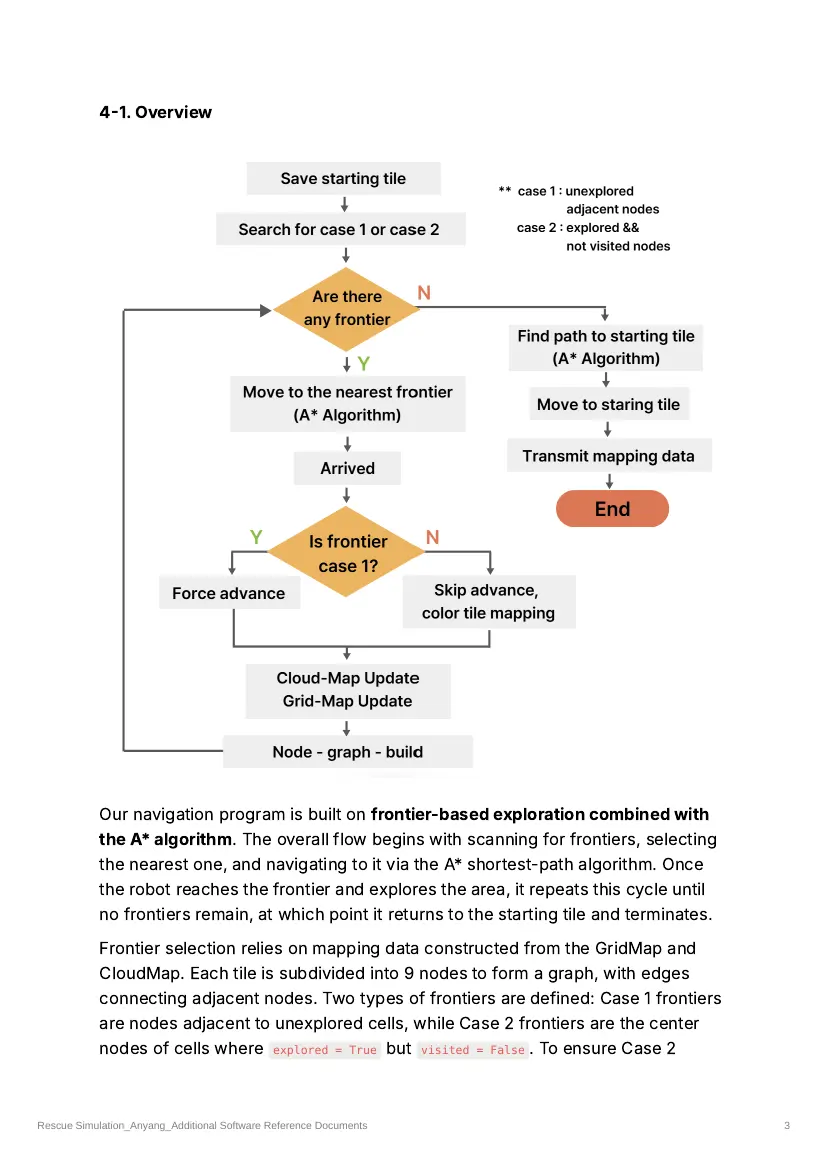
Our navigation program is built on frontier-based exploration combined with
the A* algorithm. The overall flow begins with scanning for frontiers, selecting
the nearest one, and navigating to it via the A* shortest-path algorithm. Once
the robot reaches the frontier and explores the area, it repeats this cycle until
no frontiers remain, at which point it returns to the starting tile and terminates.
Frontier selection relies on mapping data constructed from the GridMap and
CloudMap. Each tile is subdivided into 9 nodes to form a graph, with edges
connecting adjacent nodes. Two types of frontiers are defined: Case 1 frontiers
are nodes adjacent to unexplored cells, while Case 2 frontiers are the center
nodes of cells where explored = True but visited = False . To ensure Case 2
Rescue Simulation_Anyang_Additional Software Reference Documents 3
frontiers are visited preferentially, their distance weight is multiplied by a factor
of 0.2.
Each Cell stores four pieces of information: wall, floor, explored , and visited .
The explored flag indicates whether more than 90% of the CloudMap points for
that Cell have been recorded, while visited indicates whether the robot has
physically reached the center of that Cell.
Upon arriving at a frontier, the robot updates the full map and proceeds to
select the next frontier. Once no frontiers remain, it returns to the starting tile
and the run is terminated.
Several terrain-handling mechanisms are also in place. When the color sensor
detects black, the robot identifies a hole, reverses, updates the floor data of the
Cell ahead, and removes the corresponding nodes and edges from the graph.
For tiles identified as swamp, the edge weights of all connected edges are
multiplied by 20 to strongly discourage routing through those areas. Color tile
zone classification is carried out when the robot reaches the center node of a
tile. If the distance sensor detects a collision with an obstacle at the same
target node three or more times, that node and its edges are deleted and the
path is replanned. Finally, if the robot's navigation target remains unchanged
for more than 50 ticks — indicating it may be stuck in a narrow passage
between half-tiles that appears traversable in the graph but physically is not —
the situation is classified as a stuck state, the relevant edge is removed, and the
path is replanned.
4-2. Research and Analysis, Reliability Tests and quality assurance
At RoboCup Korea Open 2026, navigation was carried out using Depth-First
Search (DFS) with each full tile treated as a single node. While this approach
worked in straightforward grid layouts, it proved inadequate for paths
composed of half-tiles or curved tiles, as the tile-granularity resolution made
those geometries difficult to recognize and traverse. As a result, the algorithm
could not be applied to Zone 4 at all, and the robot resorted to random driving
in that zone without any structured navigation. Further issues included
discontinuous LiDAR usage and difficulty returning to the starting tile within the
time limit. Overall, the system was assessed as inefficient and in clear need of
improvement.
To address these limitations, a new navigation architecture was designed
around three core components: a graph structure subdividing each Cell into 9
Rescue Simulation_Anyang_Additional Software Reference Documents 4
nodes, the A* shortest-path algorithm, and frontier-based exploration. A
supporting mapping system was developed using a grid-based GridMap with
LiDAR point cloud data from the CloudMap.
When generating nodes, the Cell values at each of the 9 node positions are
checked. For edge and corner positions, all overlapping Cells are verified, and
if any one of them is a wall, the node at that position is not created. Unexplored
Cells ( explored = False ) contribute their adjacent nodes to the frontier list. The
robot selects the nearest frontier and navigates to it, then advances 2 cm
toward the unexplored Cell upon arrival to physically enter it, at which point
explored is set to True .
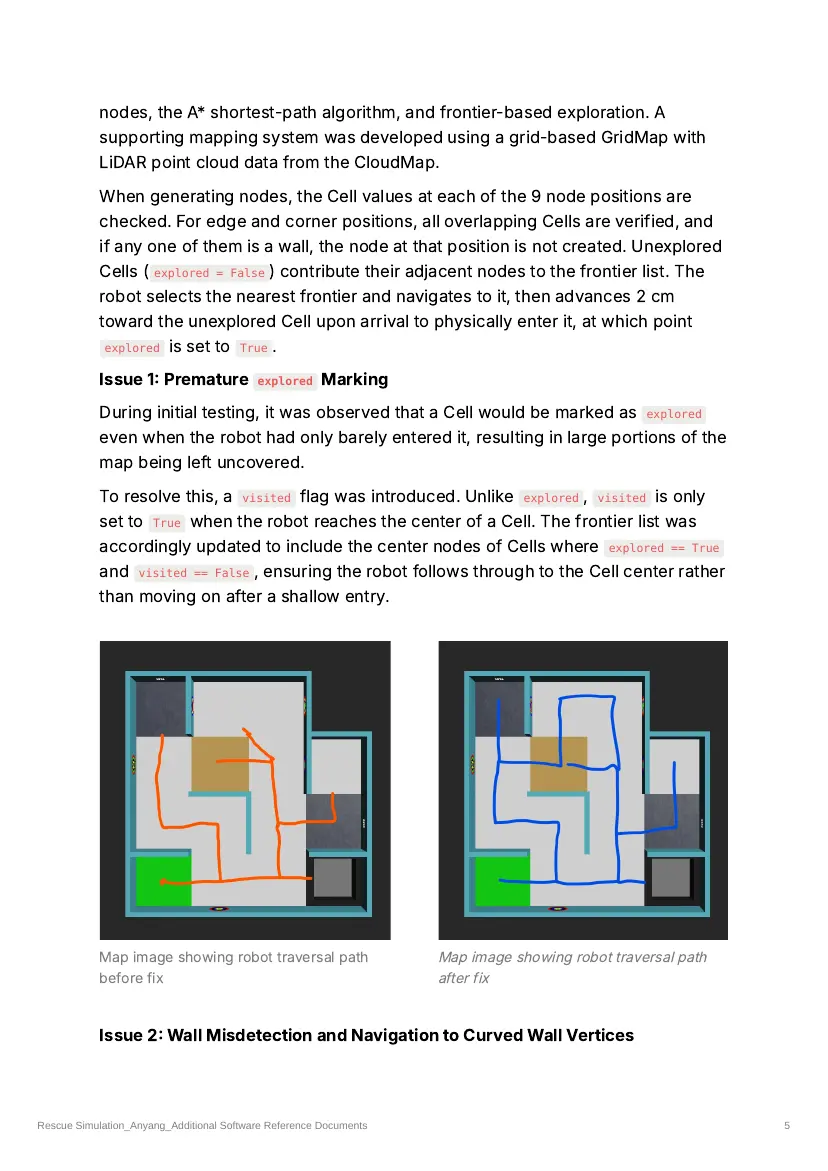
Issue 1: Premature explored Marking
During initial testing, it was observed that a Cell would be marked as explored
even when the robot had only barely entered it, resulting in large portions of the
map being left uncovered.
To resolve this, a visited flag was introduced. Unlike explored , visited is only
set to True when the robot reaches the center of a Cell. The frontier list was
accordingly updated to include the center nodes of Cells where explored == True
and visited == False , ensuring the robot follows through to the Cell center rather
than moving on after a shallow entry.
Map image showing robot traversal path Map image showing robot traversal path
before fix after fix
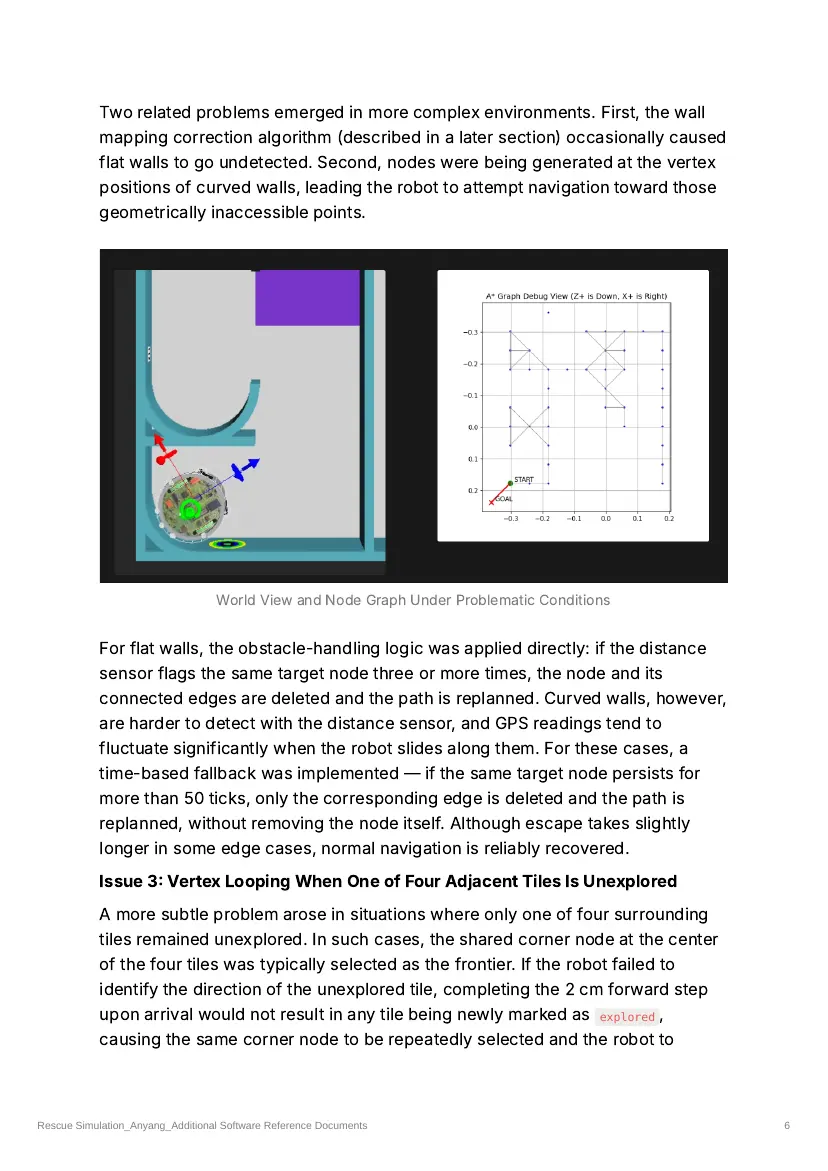
Issue 2: Wall Misdetection and Navigation to Curved Wall Vertices
Rescue Simulation_Anyang_Additional Software Reference Documents 5
Two related problems emerged in more complex environments. First, the wall
mapping correction algorithm (described in a later section) occasionally caused
flat walls to go undetected. Second, nodes were being generated at the vertex
positions of curved walls, leading the robot to attempt navigation toward those
geometrically inaccessible points.
World View and Node Graph Under Problematic Conditions
For flat walls, the obstacle-handling logic was applied directly: if the distance
sensor flags the same target node three or more times, the node and its
connected edges are deleted and the path is replanned. Curved walls, however,
are harder to detect with the distance sensor, and GPS readings tend to
fluctuate significantly when the robot slides along them. For these cases, a
time-based fallback was implemented — if the same target node persists for
more than 50 ticks, only the corresponding edge is deleted and the path is
replanned, without removing the node itself. Although escape takes slightly
longer in some edge cases, normal navigation is reliably recovered.
Issue 3: Vertex Looping When One of Four Adjacent Tiles Is Unexplored
A more subtle problem arose in situations where only one of four surrounding
tiles remained unexplored. In such cases, the shared corner node at the center
of the four tiles was typically selected as the frontier. If the robot failed to
identify the direction of the unexplored tile, completing the 2 cm forward step
upon arrival would not result in any tile being newly marked as explored ,
causing the same corner node to be repeatedly selected and the robot to
Rescue Simulation_Anyang_Additional Software Reference Documents 6
remain trapped in place. While the robot could occasionally escape if it
happened to move in the right direction, the process was time-consuming and
significantly reduced navigation efficiency.
To address this, the method for setting explored = True was revised from a GPS-
based approach to a CloudMap-based one. Under the previous method,
explored = True and wall mapping were applied to the robot's current Cell and
the four adjacent Cells based on the robot's GPS position. The revised method
instead surveys a 5×5 area centered on the robot's current Cell and marks any
Cell containing 10 or fewer _UNDEFINED cloud points in the CloudMap as explored
= True , applying wall mapping accordingly. This allows the explored status to
reflect actual sensor coverage rather than mere physical proximity.
In addition, map update timing was streamlined. Previously, updates were
triggered from various points in the code, leading to redundancy and
inconsistency. Updates are now limited to two events: upon arrival at a frontier,
and upon obstacle detection. The frontier weighting scheme was also adjusted
so that Case 2 frontiers ( explored && not visited ) are assigned a weight of 0.2×
the distance, making them significantly more attractive than Case 1 frontiers
(adjacent to unexplored areas) and prioritizing thorough Cell-center coverage
over raw frontier expansion.
Following these changes, the vertex looping problem no longer occurs. The
robot now navigates systematically toward Cell centers while reliably covering
narrow and peripheral areas such as half-tile passages.
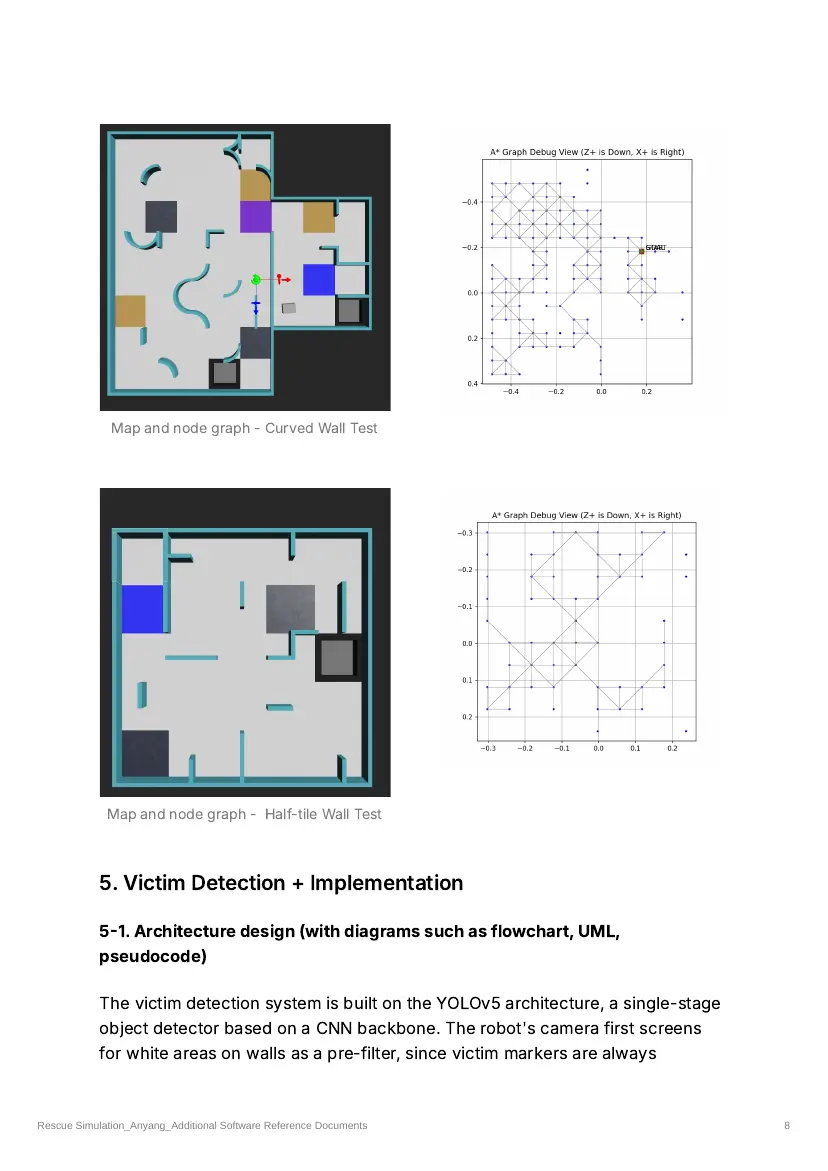
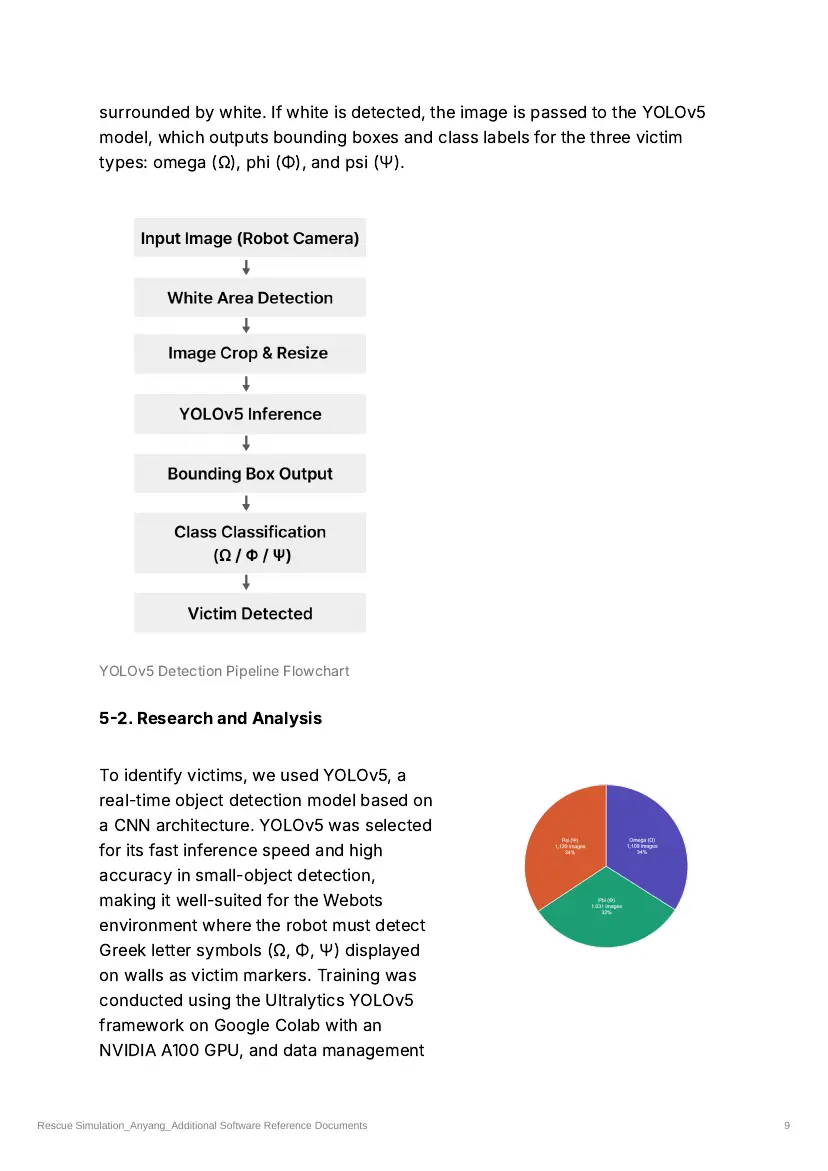
The self-designed map and its corresponding final node graph shown below
confirm that the robot navigates successfully throughout the environment.
Rescue Simulation_Anyang_Additional Software Reference Documents 7
Map and node graph - Curved Wall Test
Map and node graph - Half-tile Wall Test
5. Victim Detection + Implementation
5-1. Architecture design (with diagrams such as flowchart, UML,
pseudocode)
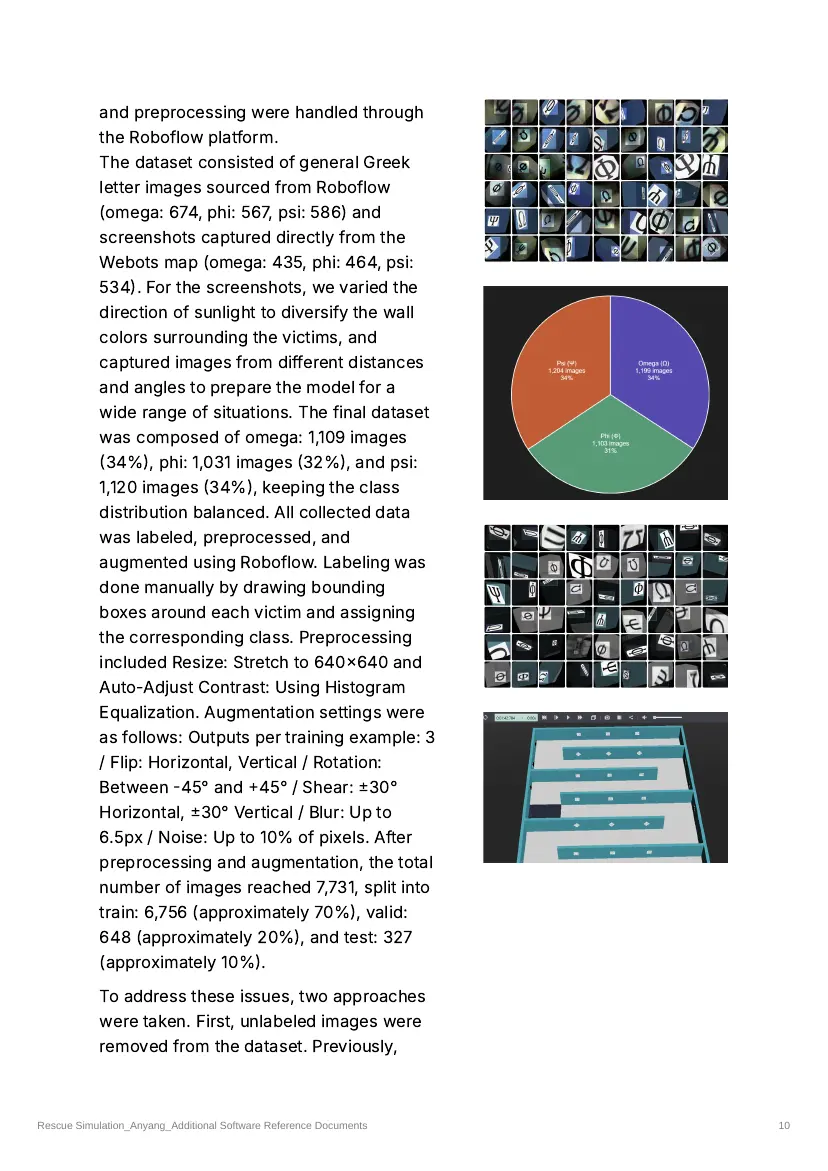
The victim detection system is built on the YOLOv5 architecture, a single-stage
object detector based on a CNN backbone. The robot's camera first screens
for white areas on walls as a pre-filter, since victim markers are always
Rescue Simulation_Anyang_Additional Software Reference Documents 8
surrounded by white. If white is detected, the image is passed to the YOLOv5
model, which outputs bounding boxes and class labels for the three victim
types: omega (Ω), phi (Φ), and psi (Ψ).
YOLOv5 Detection Pipeline Flowchart
5-2. Research and Analysis
To identify victims, we used YOLOv5, a
real-time object detection model based on
a CNN architecture. YOLOv5 was selected
for its fast inference speed and high
accuracy in small-object detection,
making it well-suited for the Webots
environment where the robot must detect
Greek letter symbols (Ω, Φ, Ψ) displayed
on walls as victim markers. Training was
conducted using the Ultralytics YOLOv5
framework on Google Colab with an
NVIDIA A100 GPU, and data management
Rescue Simulation_Anyang_Additional Software Reference Documents 9
and preprocessing were handled through
the Roboflow platform.
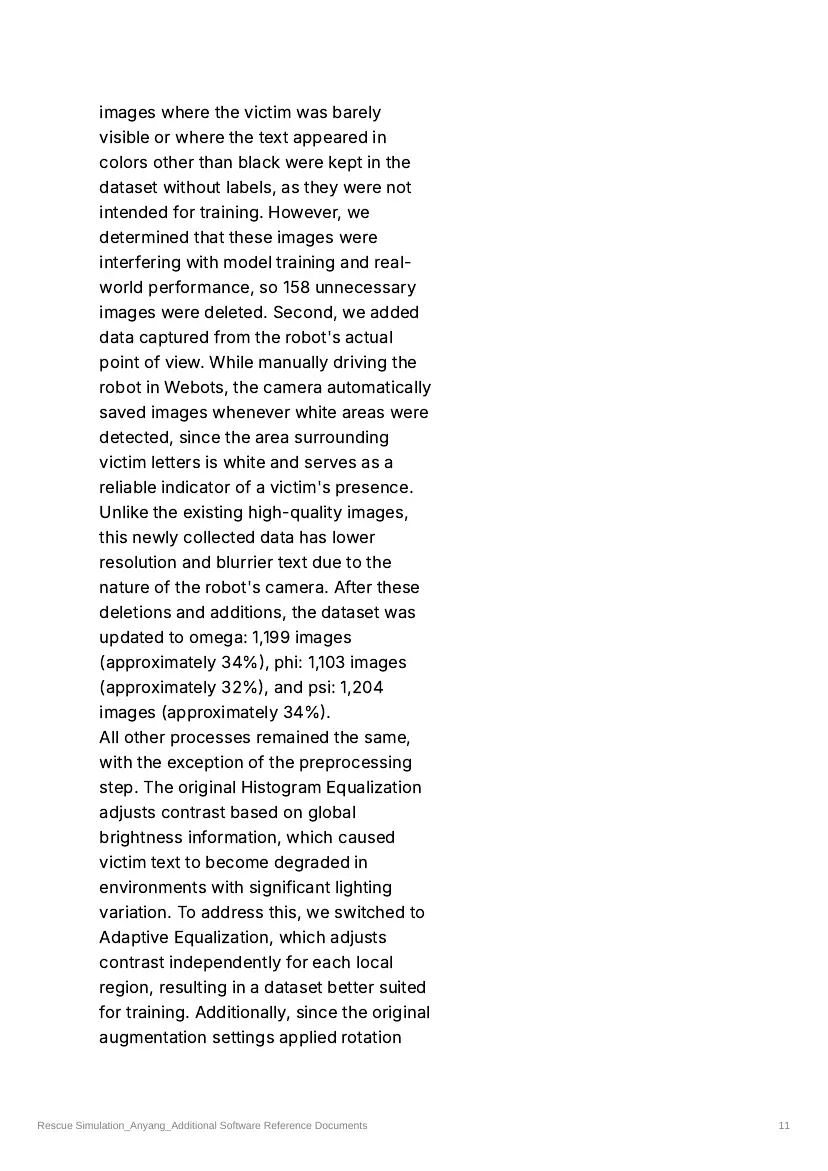
The dataset consisted of general Greek
letter images sourced from Roboflow
(omega: 674, phi: 567, psi: 586) and
screenshots captured directly from the
Webots map (omega: 435, phi: 464, psi:
534). For the screenshots, we varied the
direction of sunlight to diversify the wall
colors surrounding the victims, and
captured images from different distances
and angles to prepare the model for a
wide range of situations. The final dataset
was composed of omega: 1,109 images
(34%), phi: 1,031 images (32%), and psi:
1,120 images (34%), keeping the class
distribution balanced. All collected data
was labeled, preprocessed, and
augmented using Roboflow. Labeling was
done manually by drawing bounding
boxes around each victim and assigning
the corresponding class. Preprocessing
included Resize: Stretch to 640×640 and
Auto-Adjust Contrast: Using Histogram
Equalization. Augmentation settings were
as follows: Outputs per training example: 3
/ Flip: Horizontal, Vertical / Rotation:
Between -45° and +45° / Shear: ±30°
Horizontal, ±30° Vertical / Blur: Up to
6.5px / Noise: Up to 10% of pixels. After
preprocessing and augmentation, the total
number of images reached 7,731, split into
train: 6,756 (approximately 70%), valid:
648 (approximately 20%), and test: 327
(approximately 10%).
To address these issues, two approaches
were taken. First, unlabeled images were
removed from the dataset. Previously,
Rescue Simulation_Anyang_Additional Software Reference Documents 10
images where the victim was barely
visible or where the text appeared in
colors other than black were kept in the
dataset without labels, as they were not
intended for training. However, we
determined that these images were
interfering with model training and real-
world performance, so 158 unnecessary
images were deleted. Second, we added
data captured from the robot's actual
point of view. While manually driving the
robot in Webots, the camera automatically
saved images whenever white areas were
detected, since the area surrounding
victim letters is white and serves as a
reliable indicator of a victim's presence.
Unlike the existing high-quality images,
this newly collected data has lower
resolution and blurrier text due to the
nature of the robot's camera. After these
deletions and additions, the dataset was
updated to omega: 1,199 images
(approximately 34%), phi: 1,103 images
(approximately 32%), and psi: 1,204
images (approximately 34%).
All other processes remained the same,
with the exception of the preprocessing
step. The original Histogram Equalization
adjusts contrast based on global
brightness information, which caused
victim text to become degraded in
environments with significant lighting
variation. To address this, we switched to
Adaptive Equalization, which adjusts
contrast independently for each local
region, resulting in a dataset better suited
for training. Additionally, since the original
augmentation settings applied rotation
Rescue Simulation_Anyang_Additional Software Reference Documents 11
and blur too aggressively — making the
newly added low-quality images nearly
illegible — we adjusted the settings to
Rotation: Between -30° and +30° and
Blur: Up to 6px. We also added 90°
Rotate: Clockwise, Counter-Clockwise,
and Upside Down to account for victims
placed at 90-degree rotational intervals in
the Webots map.
Training was conducted on Google Colab
using YOLOv5, achieving an initial overall
model accuracy of 0.871. However, when
tested in the actual Webots environment
on a custom map containing 15 victims
placed at various angles, only 3 were
successfully detected. When victims were
placed at tilted angles, none of the three
types were detected at all. Among the
non-tilted victims, omega was detected
but misclassified, psi was not detected at
all, and phi was correctly identified
approximately 50% of the time.
After applying the dataset improvements
and retraining, the overall model accuracy
slightly decreased to 0.865. However, in
the actual Webots environment, the
updated model successfully detected all
15 victims on the same map, correctly
identifying both rotated and upright
victims. This confirms that real-world
performance is a more meaningful
measure of reliability than benchmark
accuracy alone, and that dataset quality
and diversity have a greater impact on
detection performance than raw accuracy
scores.
Rescue Simulation_Anyang_Additional Software Reference Documents 12
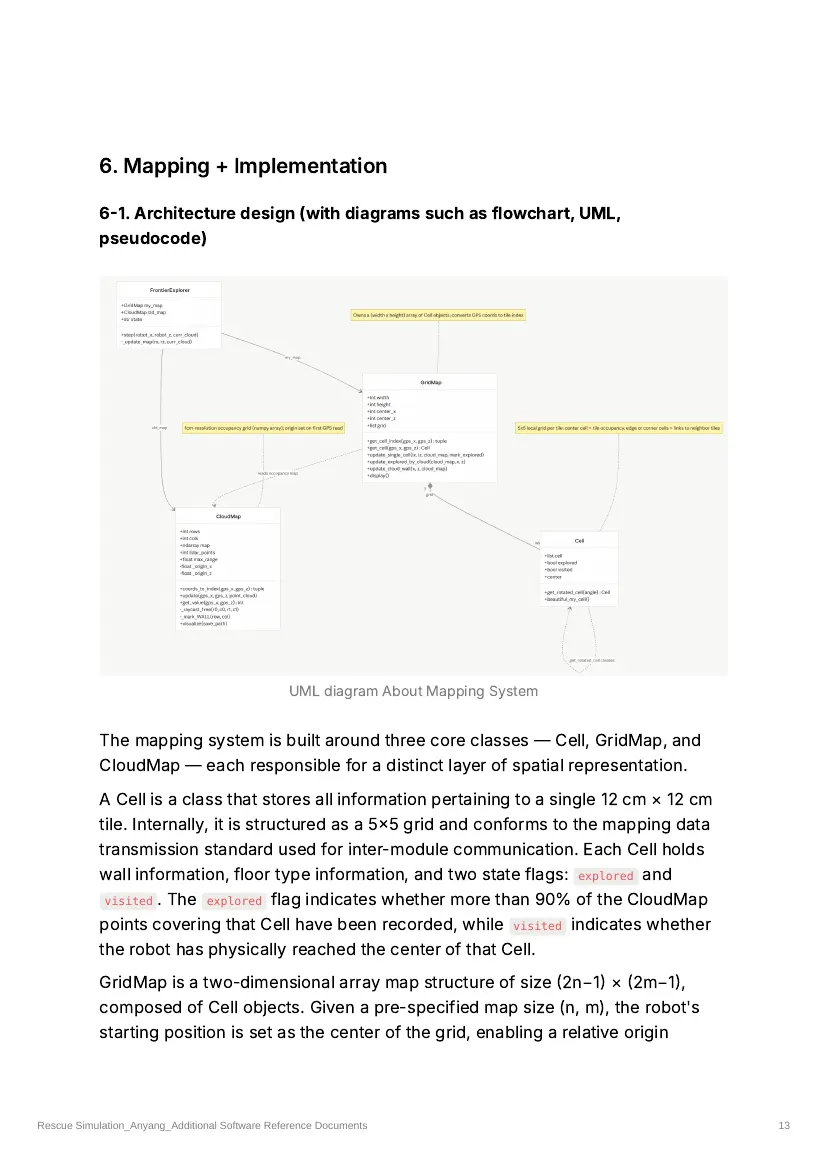
6. Mapping + Implementation
6-1. Architecture design (with diagrams such as flowchart, UML,
pseudocode)
UML diagram About Mapping System
The mapping system is built around three core classes — Cell, GridMap, and
CloudMap — each responsible for a distinct layer of spatial representation.
A Cell is a class that stores all information pertaining to a single 12 cm × 12 cm
tile. Internally, it is structured as a 5×5 grid and conforms to the mapping data
transmission standard used for inter-module communication. Each Cell holds
wall information, floor type information, and two state flags: explored and
visited . The explored flag indicates whether more than 90% of the CloudMap
points covering that Cell have been recorded, while visited indicates whether
the robot has physically reached the center of that Cell.
GridMap is a two-dimensional array map structure of size (2n−1) × (2m−1),
composed of Cell objects. Given a pre-specified map size (n, m), the robot's
starting position is set as the center of the grid, enabling a relative origin
Rescue Simulation_Anyang_Additional Software Reference Documents 13
system that allows dynamic adaptation regardless of the direction in which the
robot explores.
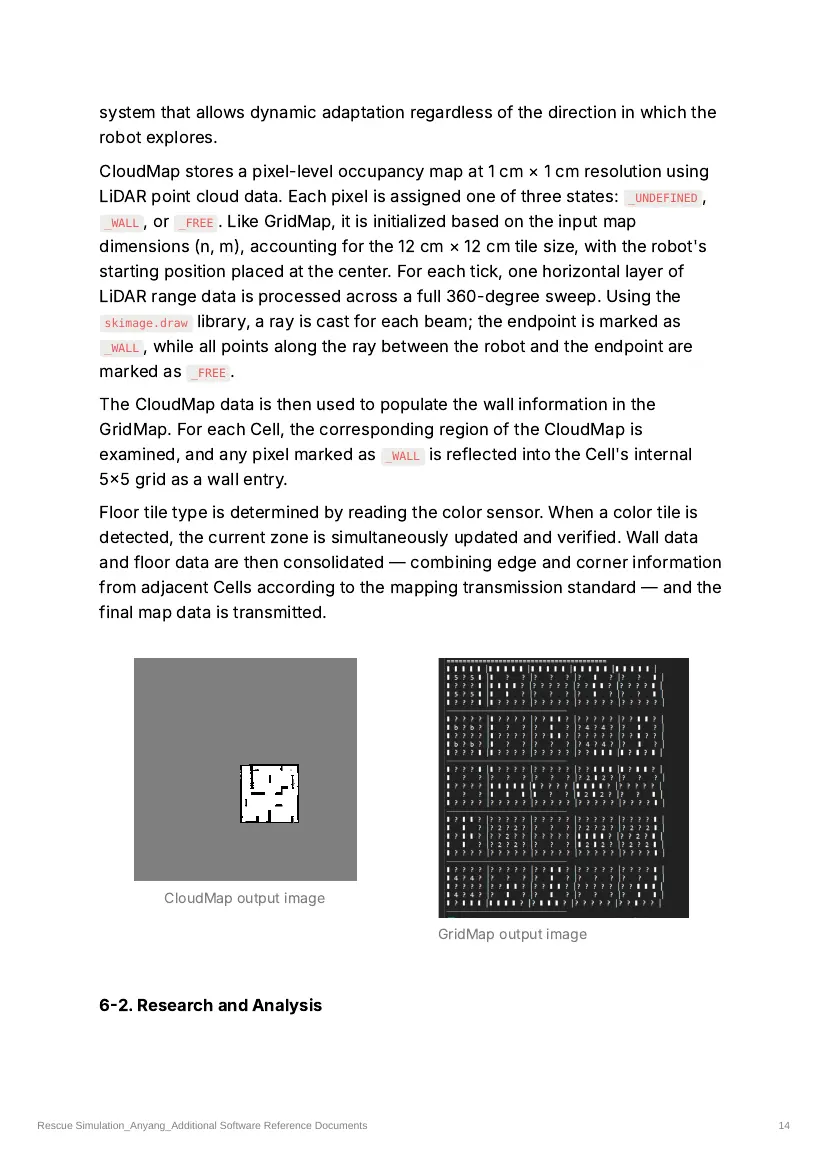
CloudMap stores a pixel-level occupancy map at 1 cm × 1 cm resolution using
LiDAR point cloud data. Each pixel is assigned one of three states: _UNDEFINED ,
_WALL , or _FREE . Like GridMap, it is initialized based on the input map
dimensions (n, m), accounting for the 12 cm × 12 cm tile size, with the robot's
starting position placed at the center. For each tick, one horizontal layer of
LiDAR range data is processed across a full 360-degree sweep. Using the
skimage.draw library, a ray is cast for each beam; the endpoint is marked as
_WALL , while all points along the ray between the robot and the endpoint are
marked as _FREE .
The CloudMap data is then used to populate the wall information in the
GridMap. For each Cell, the corresponding region of the CloudMap is
examined, and any pixel marked as _WALL is reflected into the Cell's internal
5×5 grid as a wall entry.
Floor tile type is determined by reading the color sensor. When a color tile is
detected, the current zone is simultaneously updated and verified. Wall data
and floor data are then consolidated — combining edge and corner information
from adjacent Cells according to the mapping transmission standard — and the
final map data is transmitted.
CloudMap output image
GridMap output image
6-2. Research and Analysis
Rescue Simulation_Anyang_Additional Software Reference Documents 14
As described in the navigation section, the approach used at the February 2026
competition relied on tile-by-tile movement, with wall mapping performed via
LiDAR point cloud data collected at each tile center. This meant that wall
information was captured only at discrete, non-contiguous positions, producing
a fragmented representation with significant gaps between sampling points.
Since the revised navigation system required continuous, high-resolution wall
data to support subgraph construction and fine-grained pathfinding,
developing a continuously updated CloudMap became a foundational
requirement.
The adopted approach marks wall information at 1 cm resolution in the
CloudMap and subsequently transfers it into the corresponding GridMap Cells.
To manage noise and prevent error accumulation from distant readings, the
effective LiDAR range is capped at 25 cm from the robot center — slightly more
than two tile widths. Any hit detected beyond this distance is not marked as
_WALL , keeping the map clean and minimizing long-range inaccuracy.
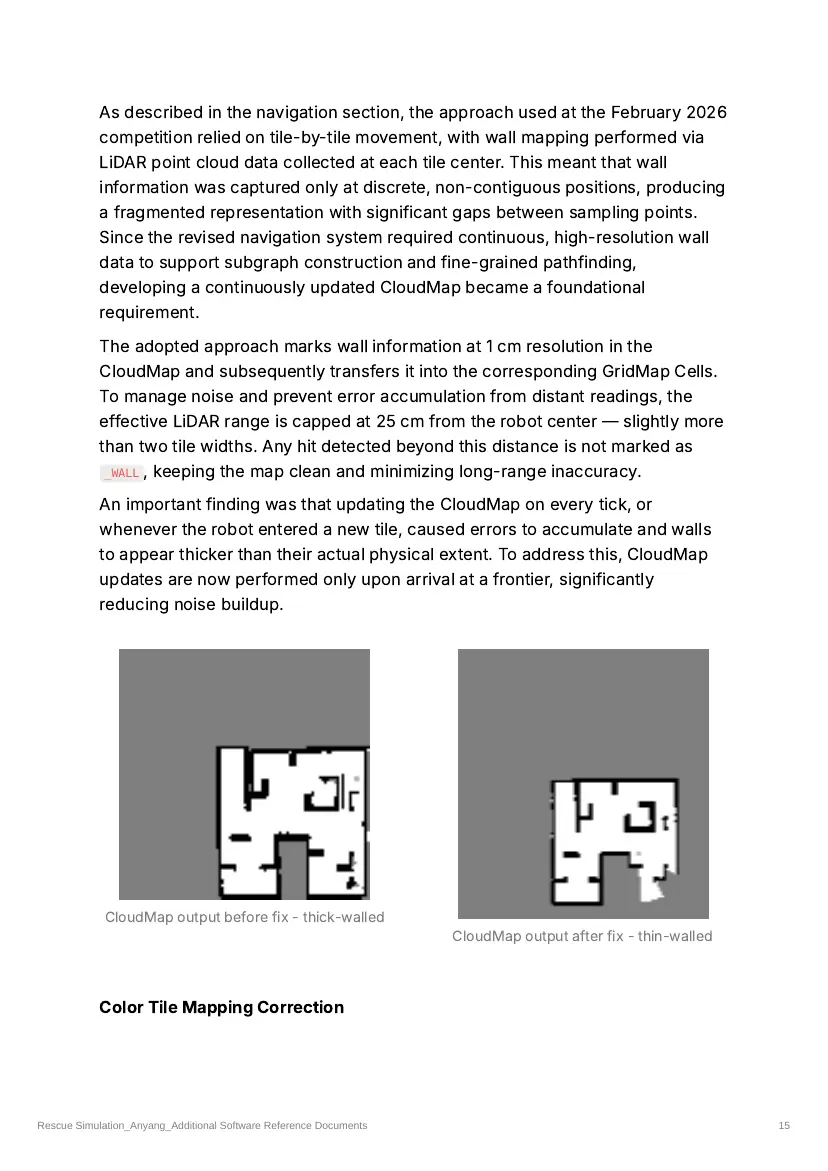
An important finding was that updating the CloudMap on every tick, or
whenever the robot entered a new tile, caused errors to accumulate and walls
to appear thicker than their actual physical extent. To address this, CloudMap
updates are now performed only upon arrival at a frontier, significantly
reducing noise buildup.
CloudMap output before fix - thick-walled
CloudMap output after fix - thin-walled
Color Tile Mapping Correction
Rescue Simulation_Anyang_Additional Software Reference Documents 15
A positioning discrepancy was identified in the color tile mapping process.
Because the GPS receiver is located at the robot's center while the color sensor
is mounted at the robot's front, the two can be observing different tiles
simultaneously. This mismatch caused a single swamp tile, for example, to be
recorded multiple times across different cells, effectively duplicating terrain
features. To resolve this, the navigation module was updated to perform color
tile mapping exclusively when the robot is at a tile center node, eliminating
spurious multi-tile detections entirely.
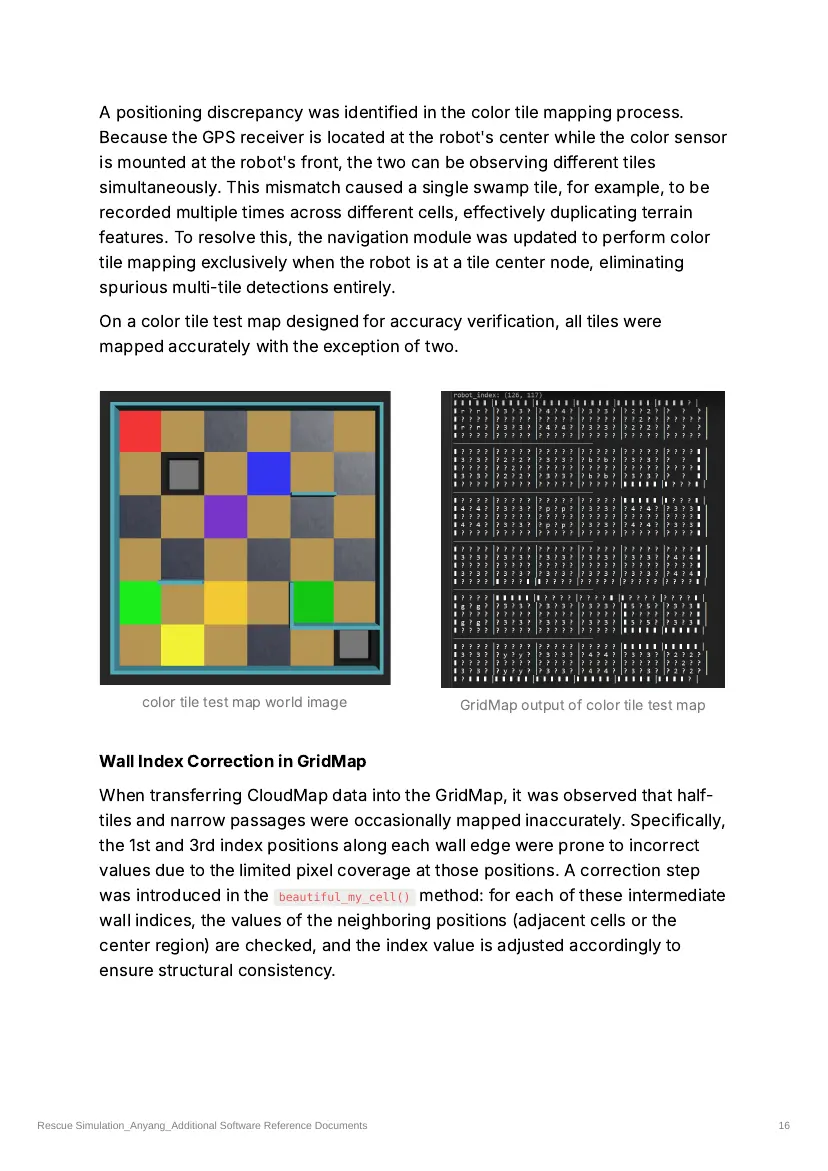
On a color tile test map designed for accuracy verification, all tiles were
mapped accurately with the exception of two.
color tile test map world image GridMap output of color tile test map
Wall Index Correction in GridMap
When transferring CloudMap data into the GridMap, it was observed that half-
tiles and narrow passages were occasionally mapped inaccurately. Specifically,
the 1st and 3rd index positions along each wall edge were prone to incorrect
values due to the limited pixel coverage at those positions. A correction step
was introduced in the beautiful_my_cell() method: for each of these intermediate
wall indices, the values of the neighboring positions (adjacent cells or the
center region) are checked, and the index value is adjusted accordingly to
ensure structural consistency.
Rescue Simulation_Anyang_Additional Software Reference Documents 16
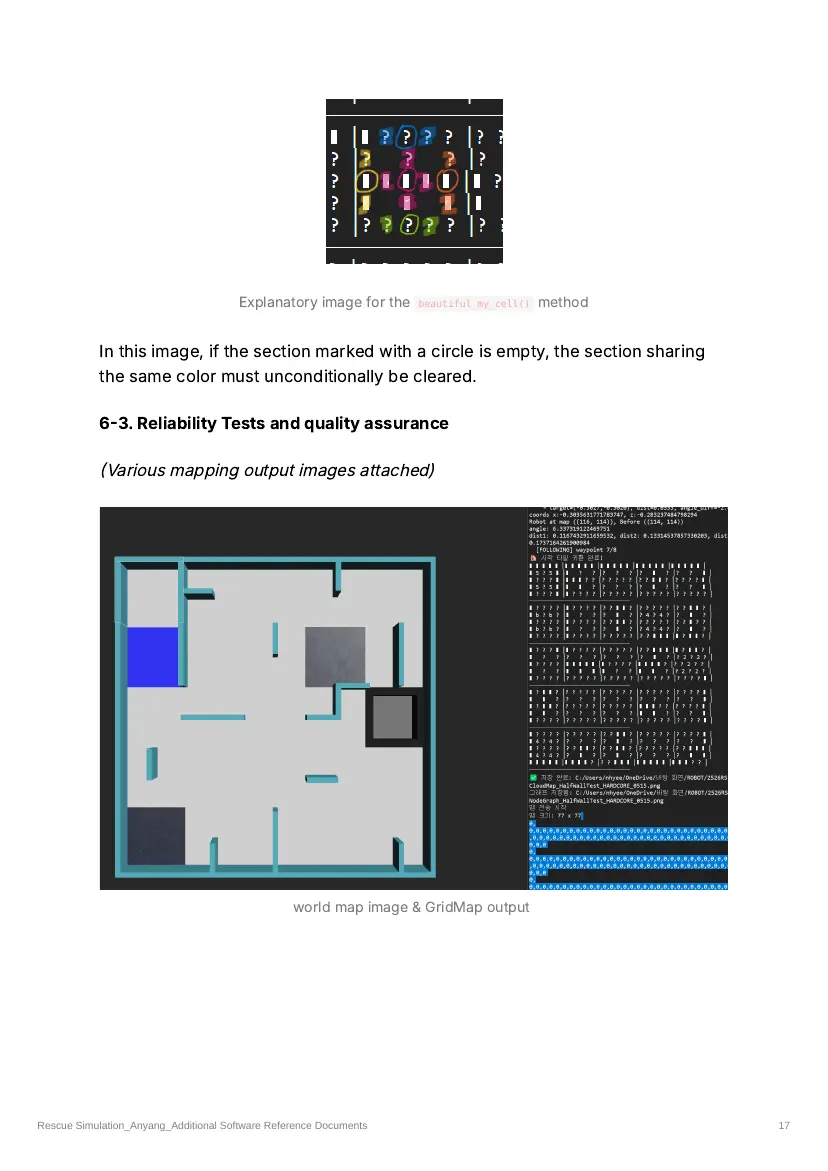
Explanatory image for the beautiful_my_cell() method
In this image, if the section marked with a circle is empty, the section sharing
the same color must unconditionally be cleared.
6-3. Reliability Tests and quality assurance
(Various mapping output images attached)
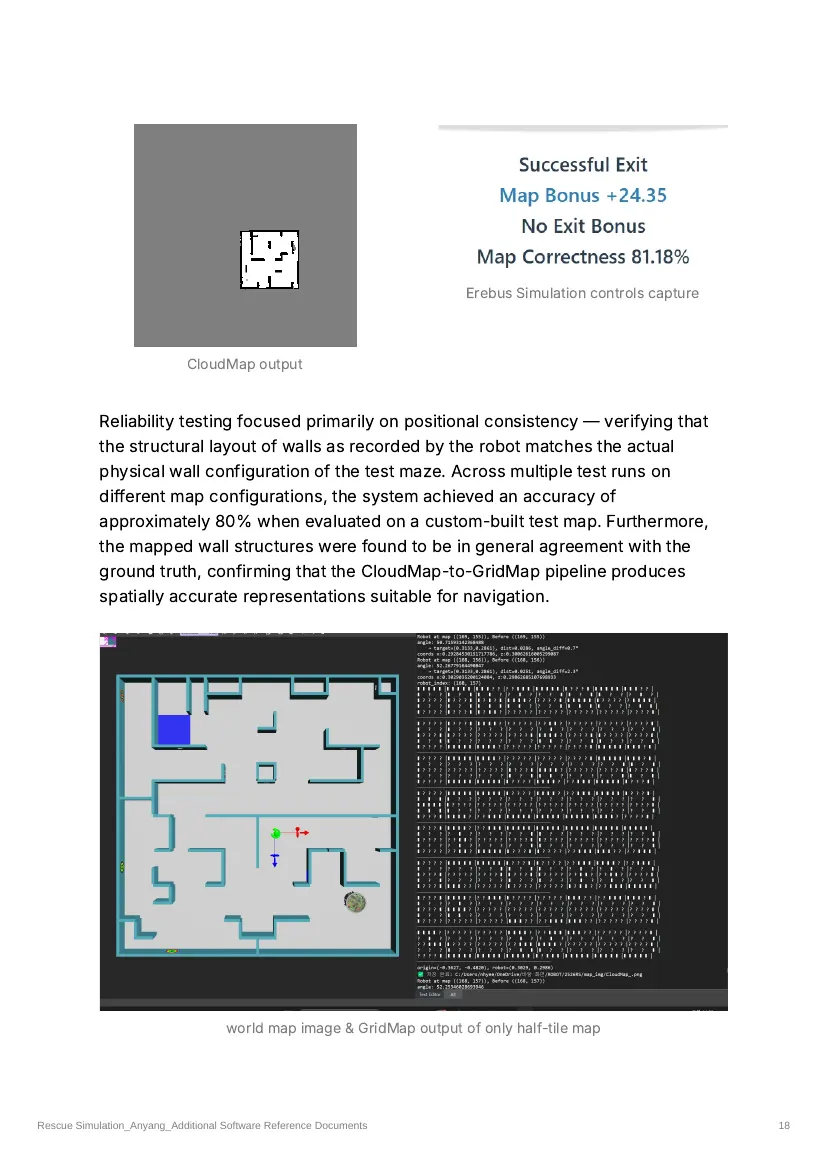
world map image & GridMap output
Rescue Simulation_Anyang_Additional Software Reference Documents 17
Erebus Simulation controls capture
CloudMap output
Reliability testing focused primarily on positional consistency — verifying that
the structural layout of walls as recorded by the robot matches the actual
physical wall configuration of the test maze. Across multiple test runs on
different map configurations, the system achieved an accuracy of
approximately 80% when evaluated on a custom-built test map. Furthermore,
the mapped wall structures were found to be in general agreement with the
ground truth, confirming that the CloudMap-to-GridMap pipeline produces
spatially accurate representations suitable for navigation.
world map image & GridMap output of only half-tile map
Rescue Simulation_Anyang_Additional Software Reference Documents 18
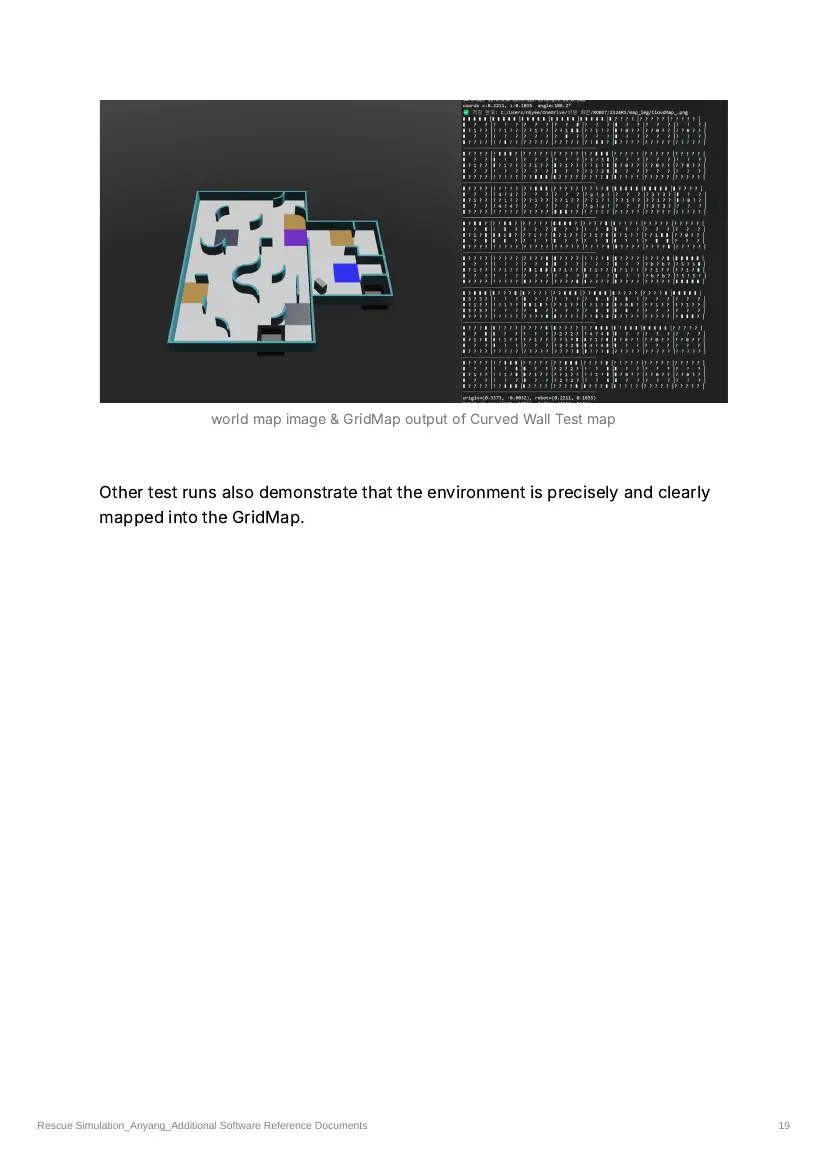
world map image & GridMap output of Curved Wall Test map
Other test runs also demonstrate that the environment is precisely and clearly
mapped into the GridMap.
Rescue Simulation_Anyang_Additional Software Reference Documents 19
19 pages, rendered as images so they load quickly. The text above is the document's own, extracted from the PDF.
Source code
The team's own source code, 42 KB. It is a download rather than part of this page, because a zip is something you open on your computer. It comes from GitHub, which some school networks block.